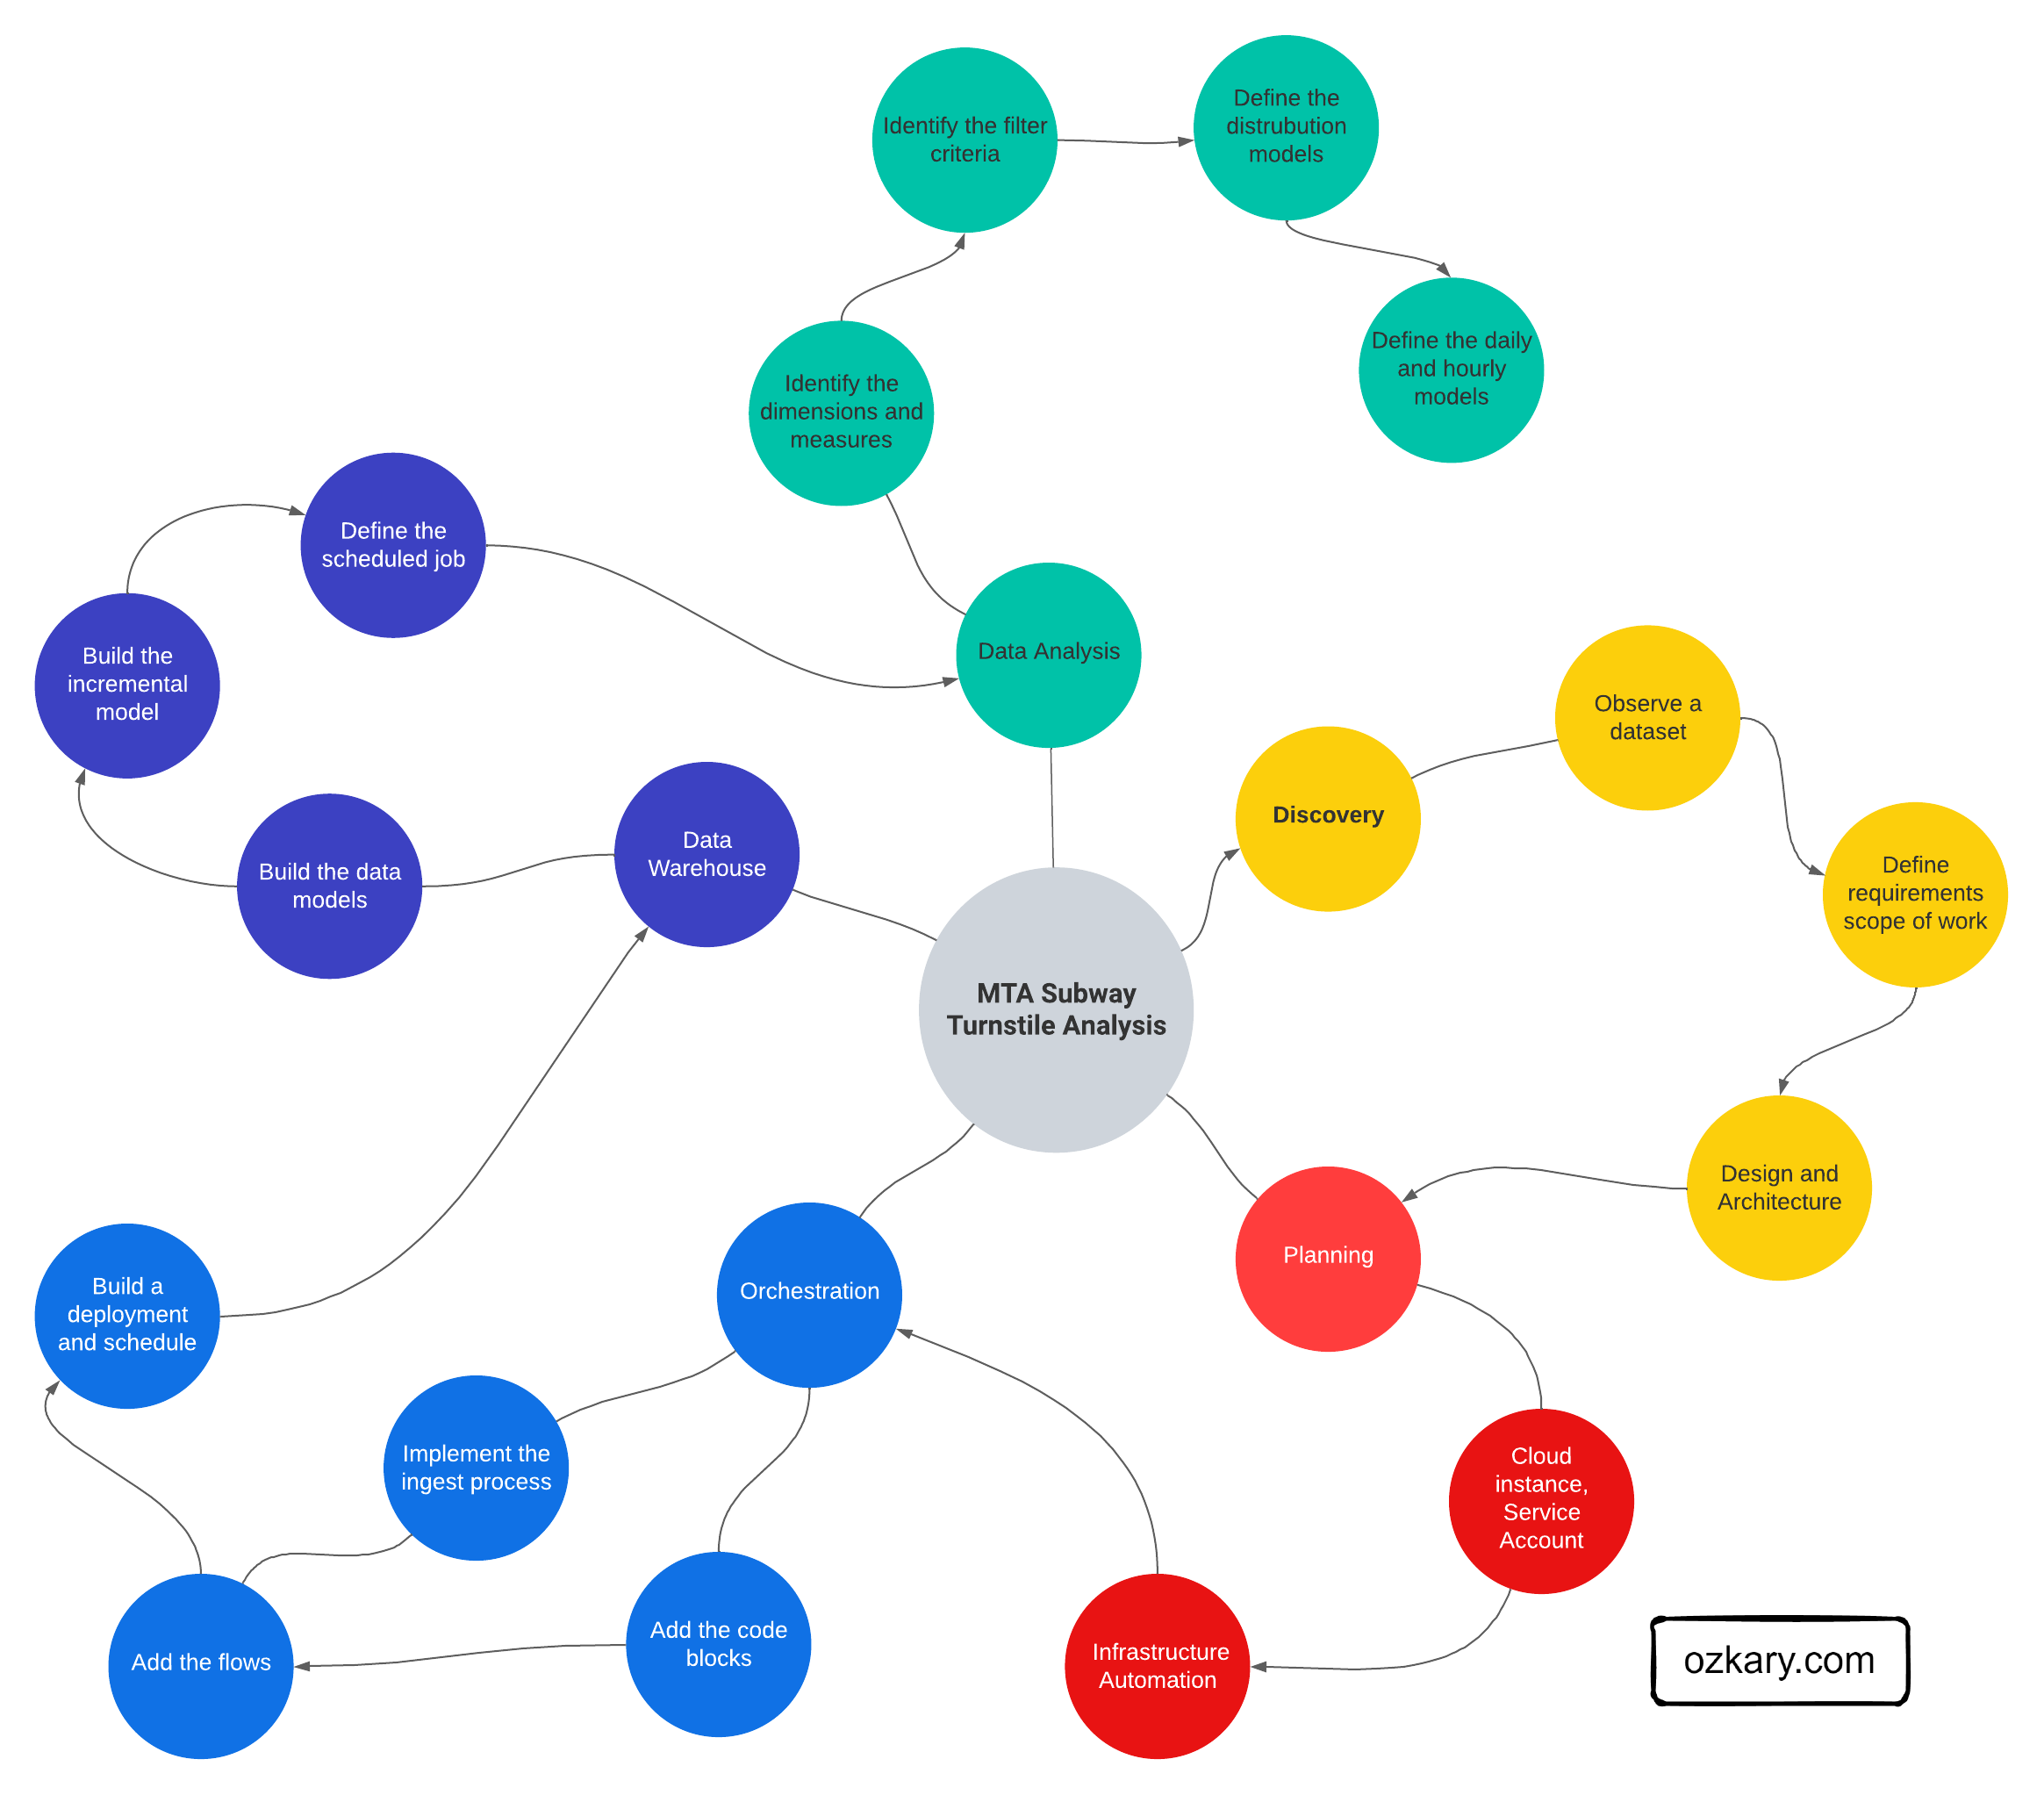
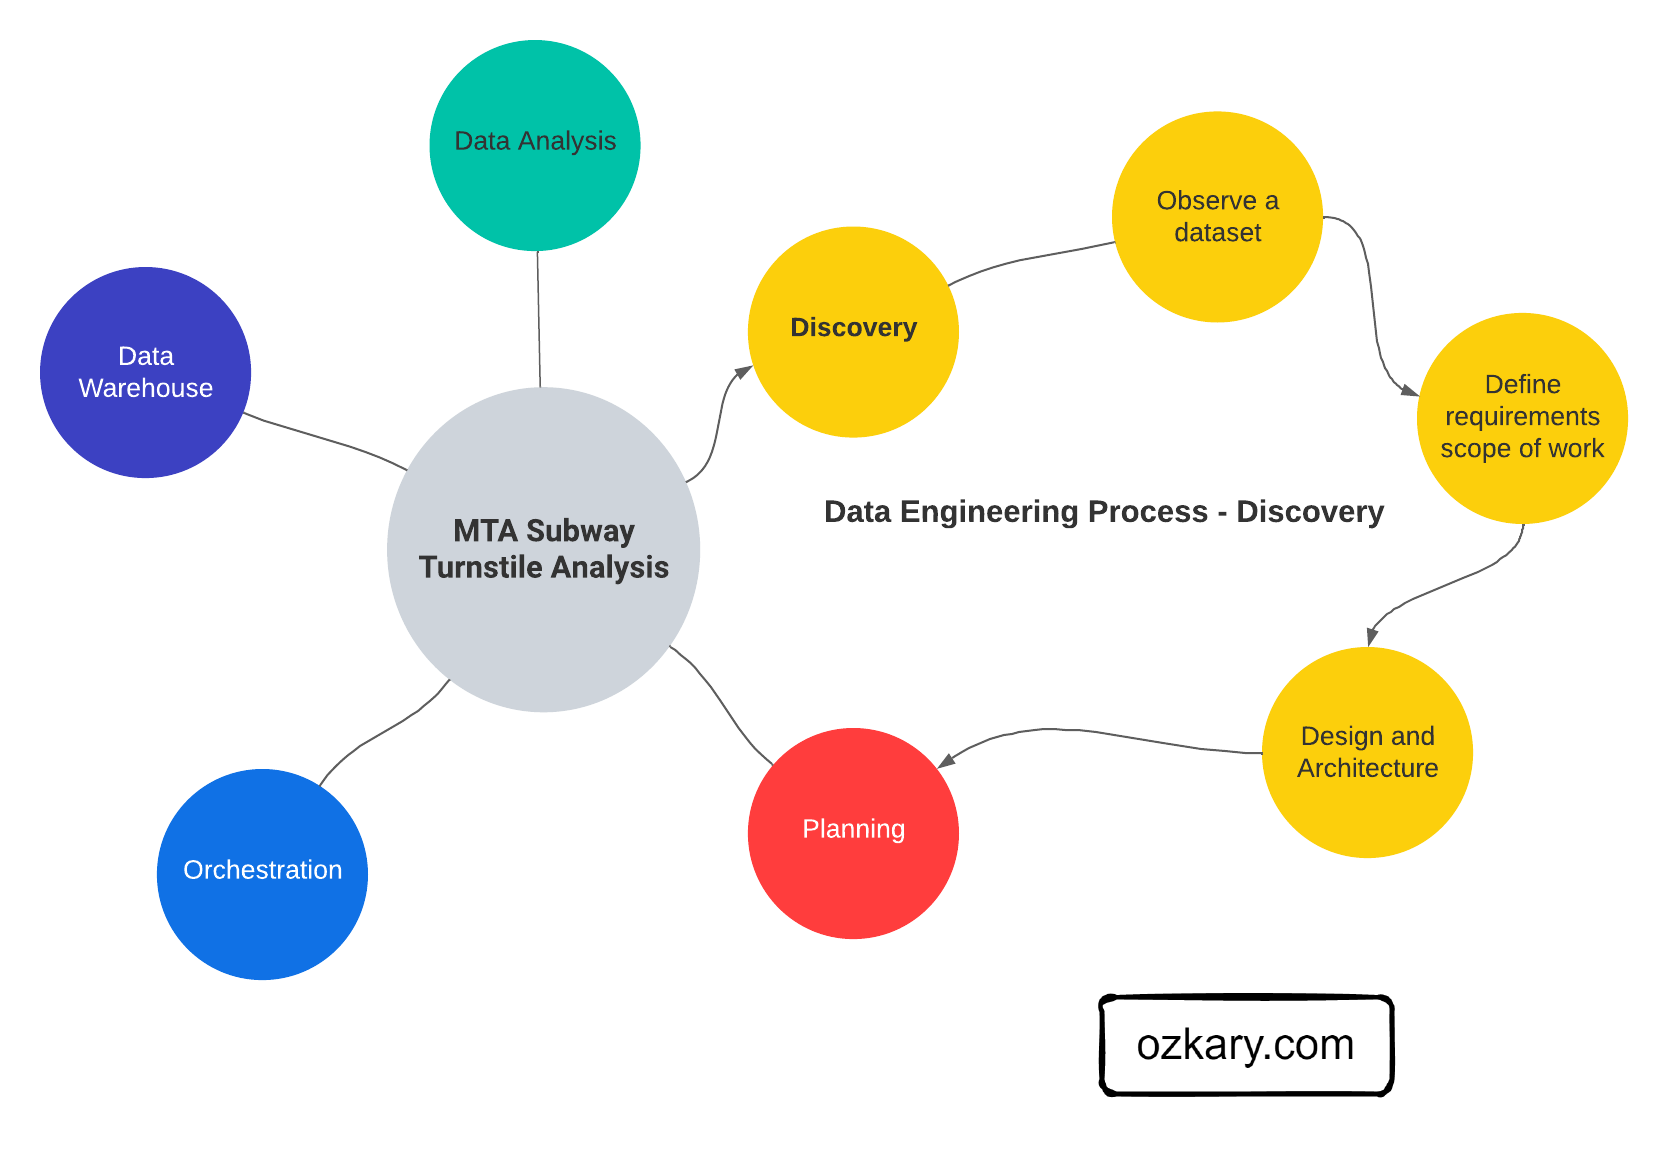
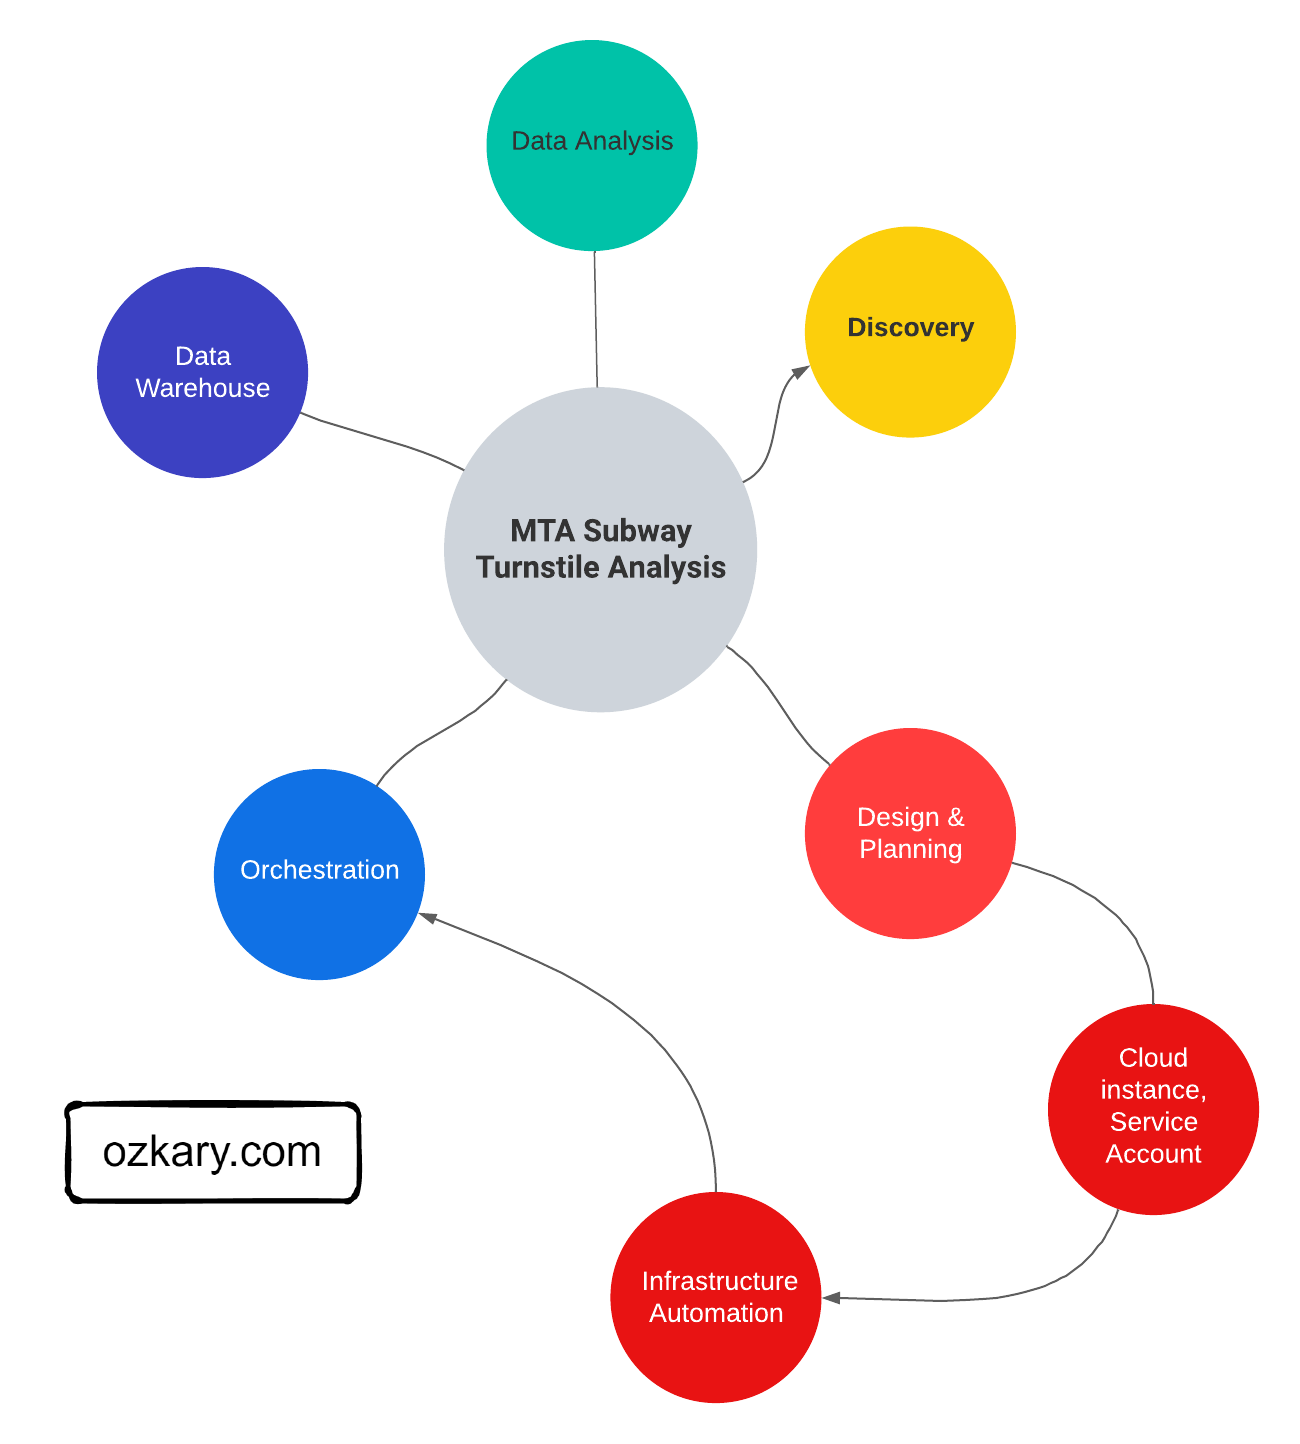
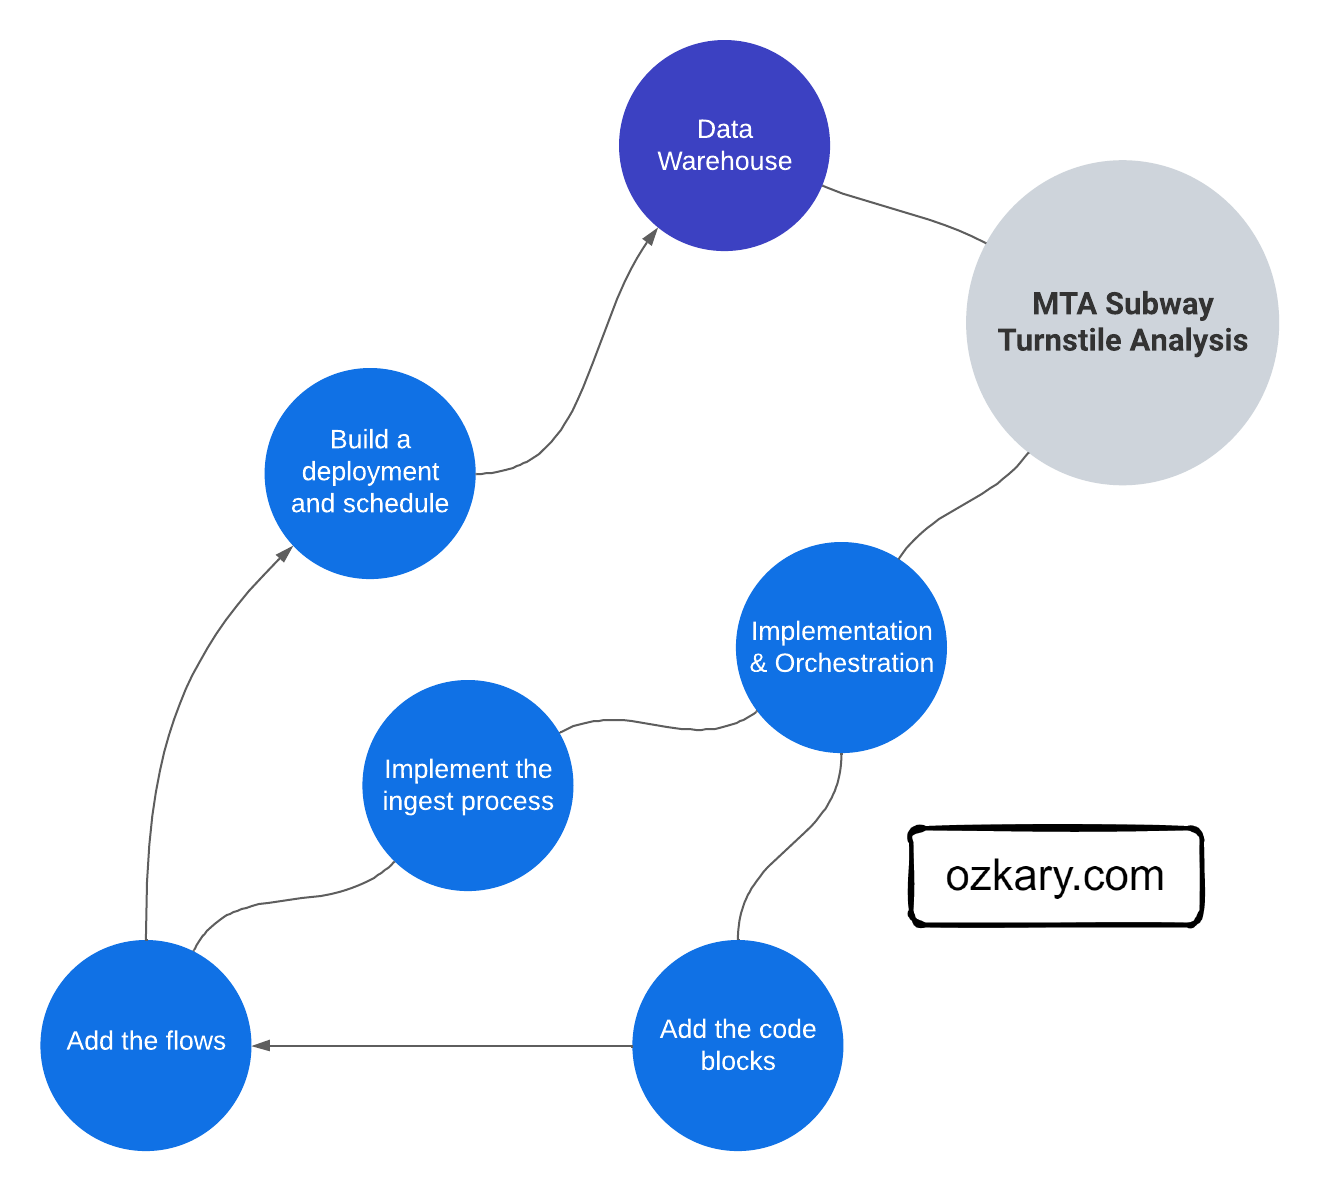
5/8/24

Unlocking Insights: Data Analysis and Visualization - Data Engineering Process Fundamentals

Overview

Delve into unlocking the insights from our data with data analysis and visualization. In this continuation of our data engineering process series, we focus on visualizing insights. We learn about best practices for data analysis and visualization, we then move into an implementation using a code-centric dashboard using Python, Pandas and Plotly. We then follow up by using a high-quality enterprise tool, such as Looker, to construct a low-code cloud-hosted dashboard, providing us with insights into the type of effort each method takes.
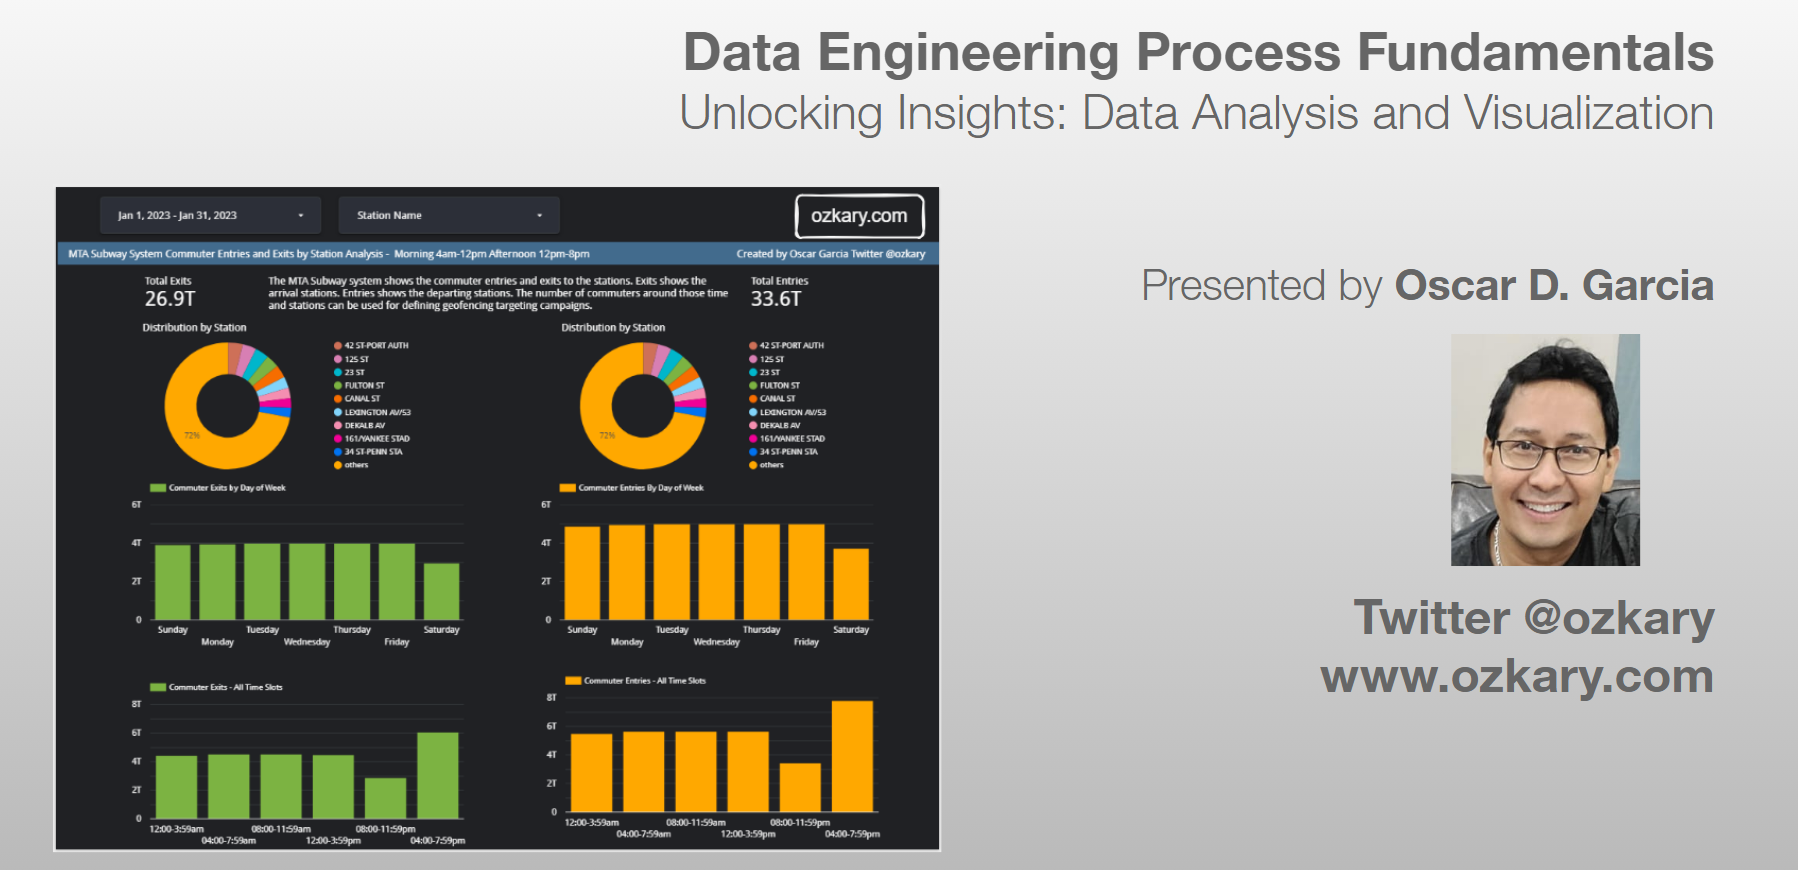
Data Engineering Process Fundamentals - Unlocking Insights: Data Analysis and Visualization

  • Follow this GitHub repo during the presentation: (Give it a star)

👉 https://github.com/ozkary/data-engineering-mta-turnstile

  • Read more information on my blog at:

👉 https://www.ozkary.com/2023/03/data-engineering-process-fundamentals.html

YouTube Video

Video Agenda

  1. Introduction:

    Recap the importance of data warehousing, data modeling and transition to data analysis and visualization.

  2. Data Analysis Foundations:

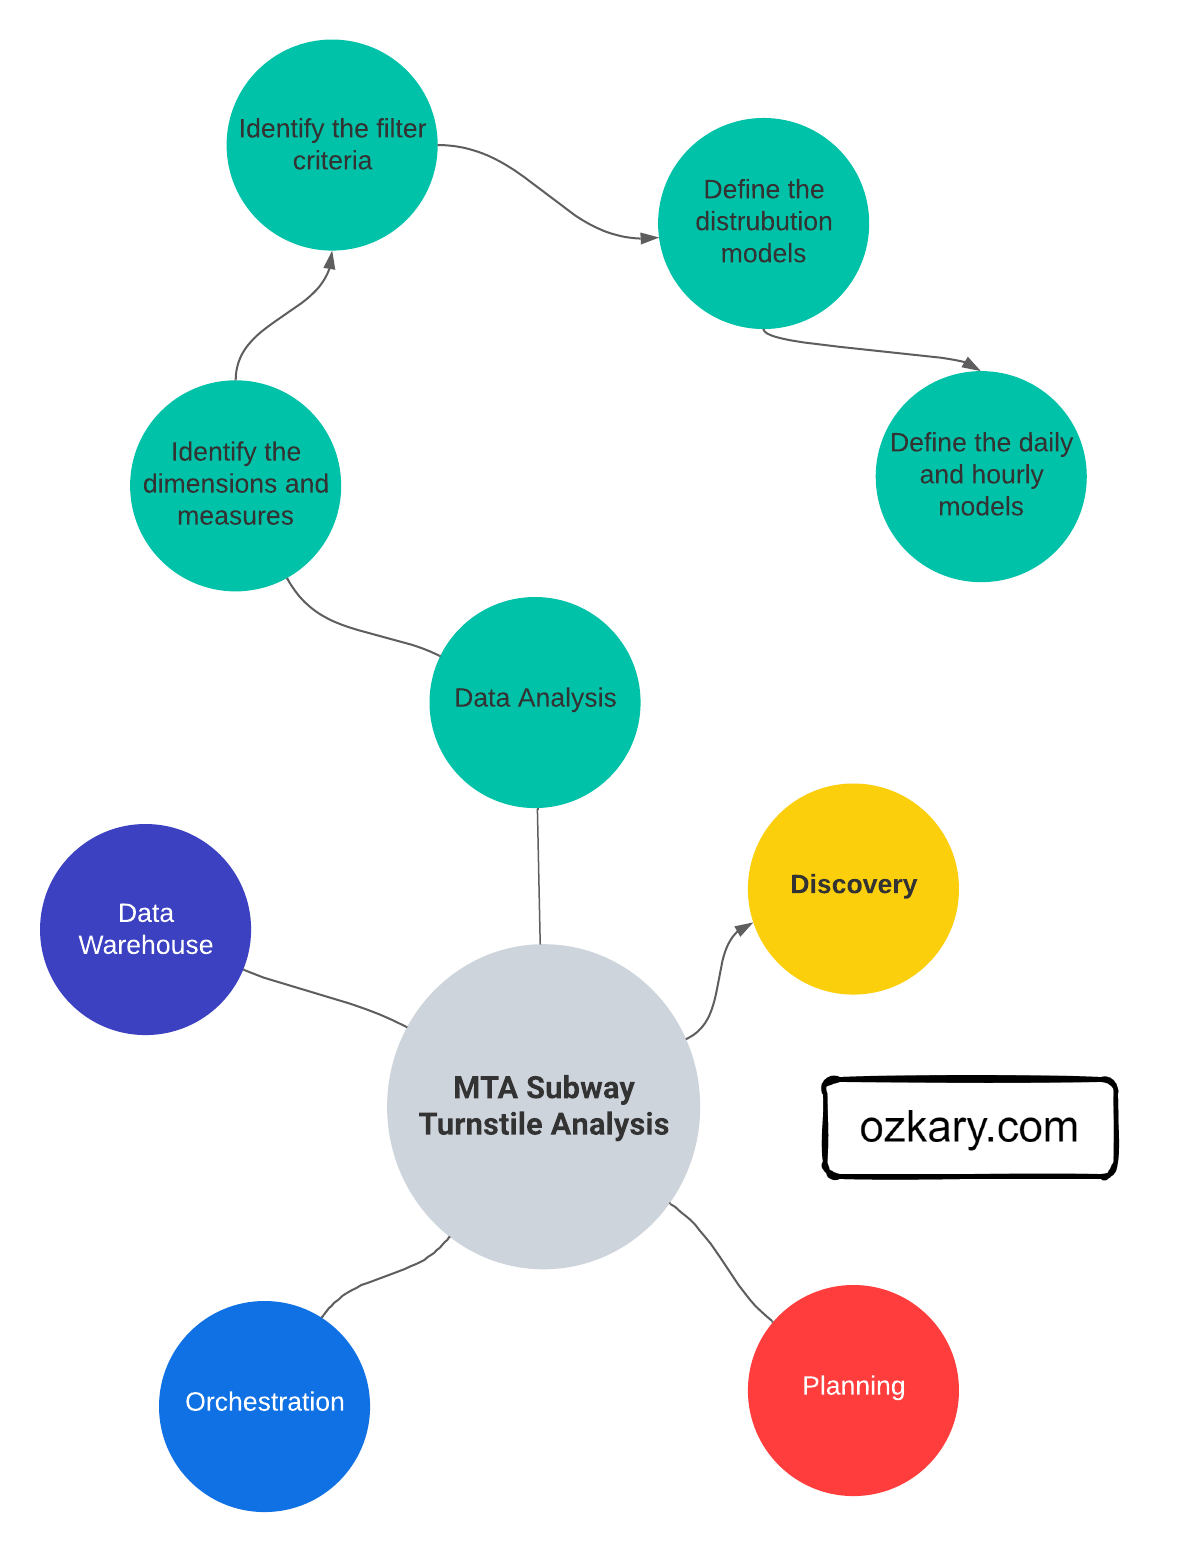
    Data Profiling: Understand the structure and characteristics of your data. Data Preprocessing: Clean and prepare data for analysis. Statistical Analysis: Utilize statistical techniques to extract meaningful patterns. Business Intelligence: Define key metrics and answer business questions. Identifying Data Analysis Requirements: Explore filtering criteria, KPIs, data distribution, and time partitioning.

  3. Mastering Data Visualization:

    Common Chart Types: Explore a variety of charts and graphs for effective data visualization. Designing Powerful Reports and Dashboards: Understand user-centered design principles for clarity, simplicity, consistency, filtering options, and mobile responsiveness. Layout Configuration and UI Components: Learn about dashboard design techniques for impactful presentations.

  4. Implementation Showcase:

    Code-Centric Dashboard: Build a data dashboard using Python, Pandas, and Plotly (demonstrates code-centric approach). Low-Code Cloud-Hosted Dashboard: Explore a high-quality enterprise tool like Looker to construct a dashboard (demonstrates low-code efficiency). Effort Comparison: Analyze the time and effort required for each development approach.

  5. Conclusion:

Recap key takeaways and the importance of data analysis and visualization for data-driven decision-making.

Why Join This Session?

  • Learn best practices for data analysis and visualization to unlock hidden insights in your data.
  • Gain hands-on experience through code-centric and low-code dashboard implementations using popular tools.
  • Understand the effort involved in different dashboard development approaches.
  • Discover how to create user-centered, impactful visualizations for data-driven decision-making.
  • This session empowers data engineers and analysts with the skills and tools to transform data into actionable insights that drive business value.

Presentation

How Do We Gather Insights From Data?

We leverage the principles of data analysis and visualization. Data analysis reveals patterns and trends, while visualization translates these insights into clear charts and graphs. It's the approach to turning raw data into actionable insights for smarter decision-making.

Let’s Explore More About:

  • Data Modeling
  • Data Analysis
    • Python and Jupyter Notebook
    • Statistical Analysis vs Business Intelligence
  • Data Visualization
    • Chart Types and Design Principles
    • Code-centric with Python Graphs
    • Low-code with tools like Looker, PowerBI, Tableau

Data Modeling

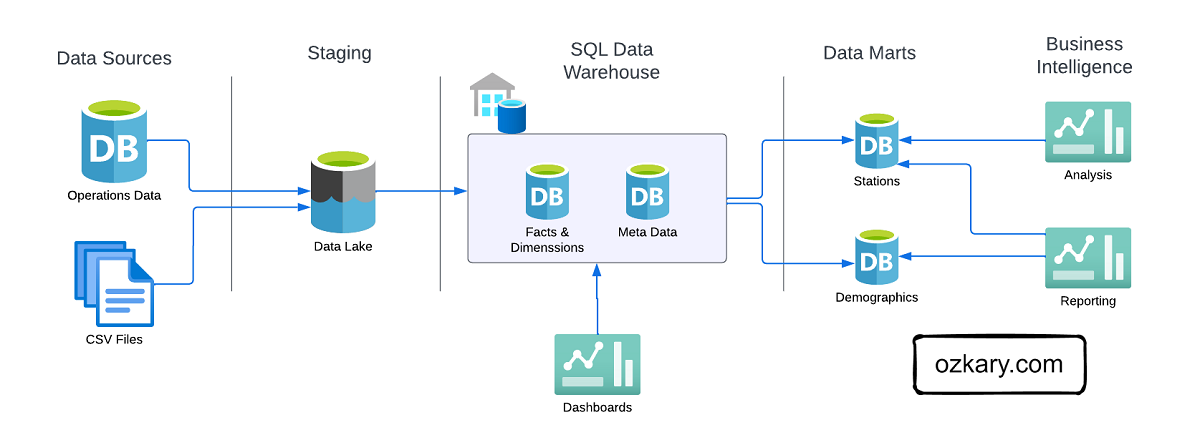
Data modeling lays the foundation for a data warehouse. It starts with modeling raw data into a logical model outlining the data and its relationships, with a focus based on data requirements. This model is then translated, using DDL, into the specific views, tables, columns (data types), and keys that make up the physical model of the data warehouse, with a focus on technical requirements.
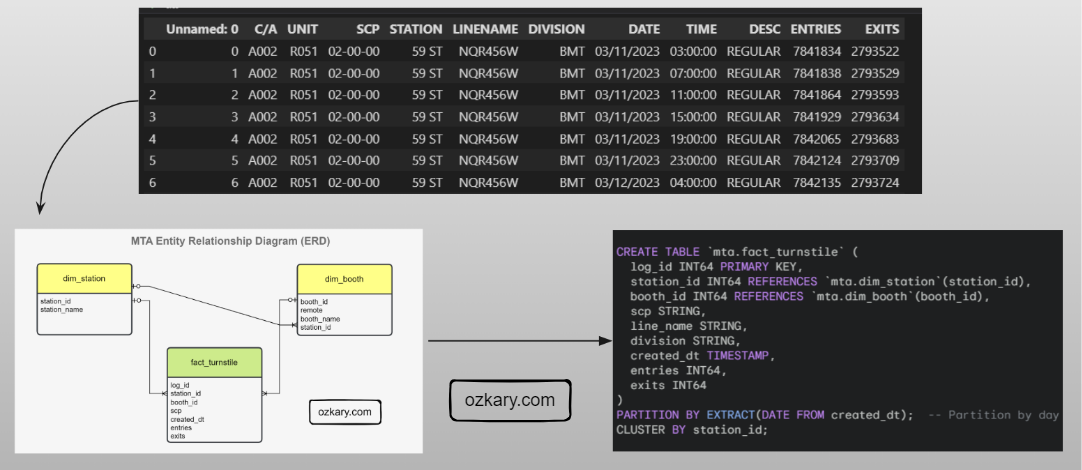
Data Engineering Process Fundamentals - Unlocking Insights: Data Analysis and Visualization - Data Modeling

Importance of a Date Dimension

A date dimension allows us to analyze your data across different time granularities (e.g., year, quarter, month, day). By storing dates and related attributes in a separate table, you can efficiently join it with your fact tables containing metrics. When filtering or selecting dates for analysis, it's generally better to choose options from the dimension table rather than directly filtering the date column in the fact table.

CREATE TABLE dim_date (
  date_id INT NOT NULL PRIMARY KEY,  -- Surrogate key for the date dimension
  full_date DATE NOT NULL,          -- Full date in YYYY-MM-DD format
  year INT NOT NULL,                -- Year (e.g., 2024)
  quarter INT NOT NULL,             -- Quarter of the year (1-4)
  month INT NOT NULL,               -- Month of the year (1-12)
  month_name VARCHAR(20) NOT NULL,    -- Name of the month (e.g., January)
  day INT NOT NULL,                 -- Day of the month (1-31)
  day_of_week INT NOT NULL,            -- Day of the week (1-7, where 1=Sunday)
  day_of_week_name VARCHAR(20) NOT NULL, -- Name of the day of the week (e.g., Sunday)
  is_weekend BOOLEAN NOT NULL,        -- Flag indicating weekend (TRUE) or weekday (FALSE)
  is_holiday BOOLEAN NOT NULL,        -- Flag indicating holiday (TRUE) or not (FALSE)
  fiscal_year INT,                   -- Fiscal year (optional)
  fiscal_quarter INT                 -- Fiscal quarter (optional)  -- Optional
);

Data Analysis

Data analysis is the practice of exploring data and understanding its meaning. It involves activities that can help us achieve a specific goal, such as identifying data dimensions and measures, as well as the process to identify outliers, trends, and distributions.

  • We can accomplish these activities by writing code using Python and Pandas, SQL, Jupyter Notebooks.
  • We can use libraries, such as Plotly, to generate some visuals to further analyze data and create prototypes.
  • The use of low-code tools also aids in the Exploratory Data Analysis (EDA) process
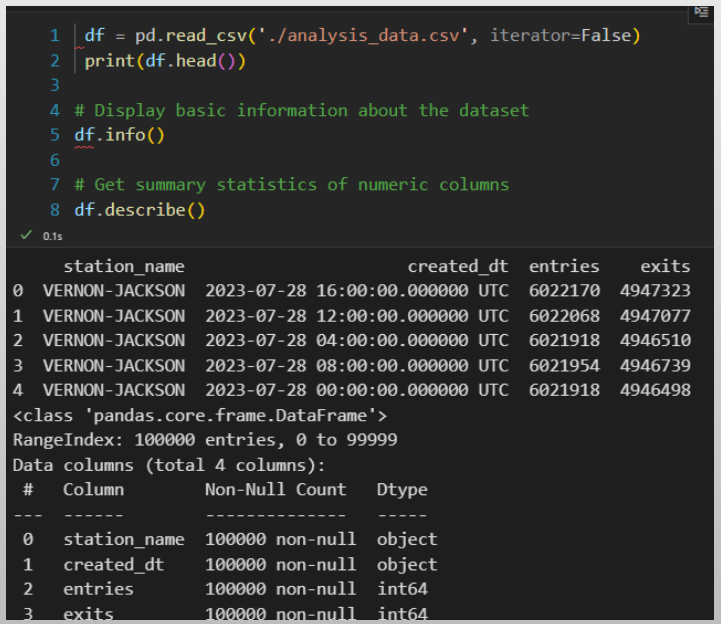
Data Engineering Process Fundamentals - Unlocking Insights: Data Analysis and Visualization - Data Analysis Python

Data Analysis - Profiling

Data profiling is the process to identify the data types, dimensions, measures, and quantitative values, which allows the analyst to view the characteristics of the data, so we can understand how to group the information.

  • Data Types: This is the type classification of the data fields. It enables us to identify categorical (text), numeric and date-time values, which define the schema
  • Dimensions: Dimensions are textual, and categorical attributes that describe business entities. They are often discrete and used for grouping, filtering, organizing and partition the data
  • Measures: Measures are the quantitative values that are subject to calculations such as sum, average, minimum, maximum, etc. They represent the KPIs that the organization wants to track and analyze
dimension data_type measure datetime_dimension
station_name True object False False
created_dt True object False True
entries False int64 True False
exits False int64 True False

Data Analysis - Cleaning and Preprocessing

Data cleaning is the process of finding bad data and outliers that can affect the results. In preprocessing, we set the data types, combine or split columns, and rename columns to follow our standards.

Bad Data:

  • Bad data could be null values
  • Values that are not within the range of the average trend for that day

Pre-Process:

  • Cast fields with the correct type
  • Rename columns and following naming conventions
  • Transform values from labels to numbers when applicable
# Check for null values in each column
null_counts = df.isnull().sum()
null_counts.head()

# fill null values with a specific value
df = df.fillna(0)

# cast a column to a specific data type
df['created_dt'] = pd.to_datetime(df['created_dt'])

# get the numeric col names and cast them to int
numeric_cols = df.select_dtypes(include=[np.number]).columns
df[numeric_cols] = df[numeric_cols].astype(int)

# Rename all columns to lowercase
df.columns = [col.lower() for col in df.columns]

Data Analysis - Preprocess Outliers

Outliers are values that are notably different from the other data points in terms of magnitude or distribution. They can be either unusually high (positive outliers) or unusually low (negative outliers) in comparison to the majority of data points.

Process:

  • Calculate the z-score for numeric values, which describes how far is the data point from a group of data
  • Define a threshold
  • Chose a value that determines when a z-score is considered high enough to be labeled as an outlier (2 or 3)
  • Identify the outliers based on the z-score
# measure outliers for entries and exits
# Calculate z-scores within each station group
z_scores = df.groupby('station_name')[numeric_cols] \
        .transform(lambda x: (x - x.mean()) / x.std())

# Set a threshold for outliers
threshold = 3

# Identify outliers based on z-scores within each station
outliers = (z_scores.abs() > threshold)

# Print the count of outliers for each station
outliers_by_station = outliers.groupby(df['station_name']).sum()
print(outliers_by_station)

Data Analysis - Statistical Analysis

Statistical analysis focuses on applying statistical techniques in order to draw meaningful conclusions about a set of data. It involves mathematical computations, probability theory, correlation analysis, and hypothesis testing to make inferences and predictions based on the data. This is use for manufacturing, data science industries, machine learning.

  • Pearson Correlation Coefficient and p-value are statistical measures used to assess the strength and significance of the linear relationship between two variables.
  • P-Value: measures the statistical significance of the correlation
  • Interpretation:
    • If the p-value is small (.05) there is solid linear correlation. Otherwise, there is no correlation
# Perform Pearson correlation test
def test_arrival_departure_correlation(df: pd.DataFrame, label: str) -> None:
   corr_coefficient, p_value = pearsonr(df['arrivals'], df['departures'])   
   p_value = round(p_value, 5)

   if p_value < 0.05:
      conclusion = f"The correlation {label} is statistically significant."
   else:
      conclusion = f"The correlation {label} is not statistically significant."

   print(f"Pearson Correlation {label} - Coefficient : {corr_coefficient} P-Value : {p_value}")    
   print(f"Conclusion: {conclusion}")

test_arrival_departure_correlation(df_top_stations, 'top-10 stations')

test_arrival_departure_correlation(df_correlation, 'all stations')

Business Intelligence and Reporting

Business intelligence (BI) is a strategic approach that involves the collection, analysis, and presentation of data to facilitate informed decision-making within an organization. In the context of business analytics, BI is a powerful tool for extracting meaningful insights from data and turning them into actionable strategies.

Analysts:

  • Look at data distribution
  • Understanding of data variations
  • Focus analysis based on locations, date and time periods
  • Provide insights that impact business operations
  • Provide insights for business strategy and decision-making
# Calculate total passengers for arrivals and departures
total_arrivals = df['exits'].sum()/divisor_t
total_departures = df['entries'].sum()/divisor_t
print(f"Total Arrivals: {total_arrivals} Total Departures: {total_departures}")

# Create distribution analysis by station
df_by_station = analyze_distribution(df,'station_name',measures,divisor_t)

# Create distribution analysis by day of the week
df_by_date = df.groupby(["created_dt"], as_index=False)[measures].sum()
day_order = ['Sun', 'Mon', 'Tue', 'Wed', 'Thu', 'Fri', 'Sat']
df_by_date["weekday"] = pd.Categorical(df_by_date["created_dt"].dt.strftime('%a'), categories=day_order, ordered=True)
df_entries_by_date = analyze_distribution(df_by_date,'weekday',measures,divisor_t)

# Create distribution analysis time slots
for slot, (start_hour, end_hour) in time_slots.items():
    slot_data = df[(df['created_dt'].dt.hour >= start_hour) & (df['created_dt'].dt.hour <= end_hour)]
    arrivals = slot_data['exits'].sum()/divisor_t
    departures = slot_data['entries'].sum()/divisor_t
    print(f"{slot.capitalize()} - Arrivals: {arrivals:.2f}, Departures: {departures:.2f}")

What is Data Visualization?

Data visualization is a practice that takes the insights derived from data analysis and presents them in a visual format. While tables with numbers on a report provide raw information, visualizations allow us to grasp complex relationships and trends at a glance with the use of charts, controls and colors.

Visualization Solutions:

  • A code-centric solution involves writing programs with a language like Python, JavaScript to manage the data analysis and create the visuals
  • A low-code solution uses cloud-hosted tools like Looker, PowerBI and Tableau to accelerate the data analysis and visualization by using a design approach
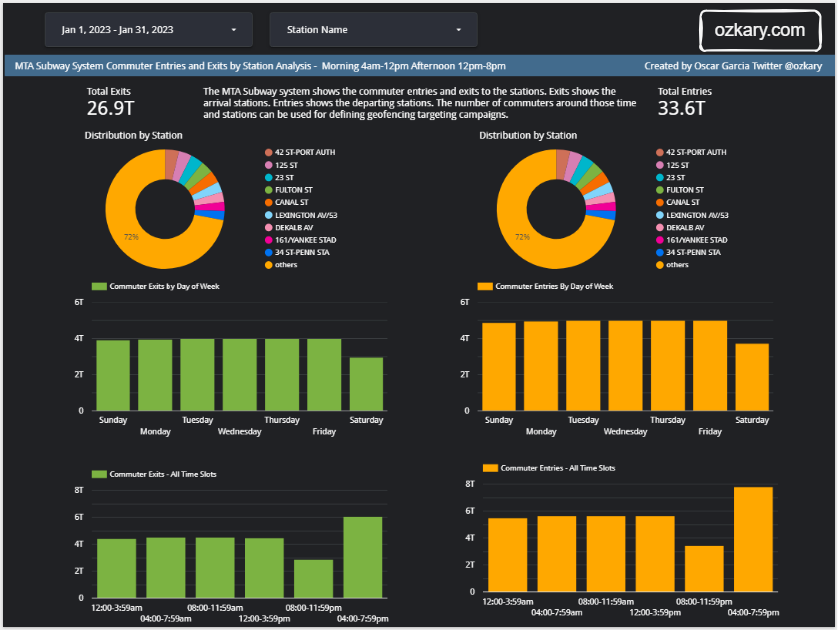
Data Engineering Process Fundamentals - Unlocking Insights: Data Analysis and Visualization - Data Visualization

Data Visualization - Design Principles

These design principles prioritize the user's experience by ensuring clarity, simplicity, and consistency.

  • User-centered design: Focus on the needs and preferences of your audience when designing your visualizations.
  • Clarity: Ensure your visualizations are easy to understand, even for people with no prior knowledge of the data.
  • Simplicity: Avoid using too much clutter or complex charts.
  • Consistency: Maintain a consistent visual style throughout your visualizations.
  • Filtering options: Allow users to filter the data based on their specific interests.
  • Device responsiveness: Design your visualizations to be responsive and viewable on all devices, including mobile phones and tablets.

Visual Perception

Over half of our brain is dedicated to processing visual information. This means our brains are constantly working to interpret and make sense of what we see.

Key elements influencing visual perception:

  • Color: Colors evoke emotions, create hierarchy, and guide the eye.

  • Size: Larger elements are perceived as more important. (Use different sized circles or bars to show emphasis)

  • Position: Elements placed at the top or center tend to grab attention first.

  • Shape: Different shapes can convey specific meanings or represent categories. (Use icons or charts with various shapes)

Statistical Analysis - Basic Charts

  • Control Charts: Monitor process stability over time, identifying potential variations or defects.
  • Histograms: Depict the frequency distribution of data points, revealing patterns and potential outliers.
  • Box Plots: Summarize the distribution of data using quartiles, providing a quick overview of central tendency and variability.
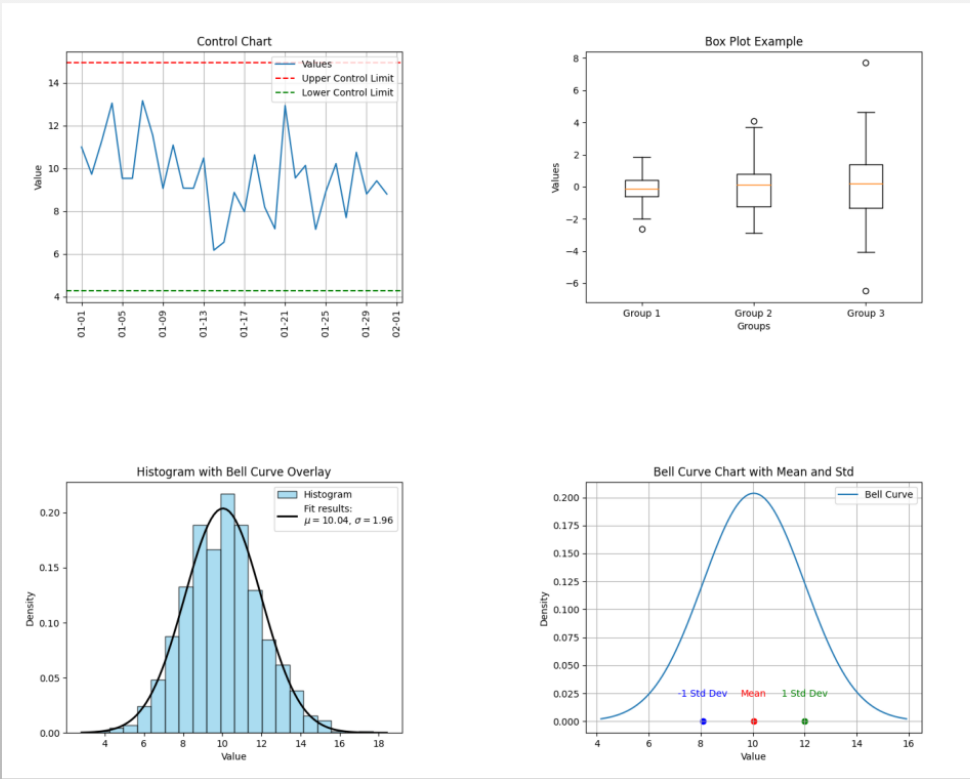
Data Engineering Process Fundamentals - Unlocking Insights: Data Analysis and Visualization - Statistical Analysis Charts

Business Intelligence Charts

  • Scorecards: Provide a concise overview of key performance indicators (KPIs) at a glance, enabling performance monitoring.
  • Pie Charts: Illustrate proportional relationships between parts of a whole, ideal for composition comparisons.
  • Doughnut Charts: Similar to pie charts but emphasize a specific category by leaving a blank center space.
  • Bar Charts: Represent comparisons between categories using rectangular bars, effective for showcasing differences in magnitude.
  • Line Charts: Reveal trends or patterns over time by connecting data points with a line, useful for visualizing continuous changes.
  • Area charts: Can be helpful for visually emphasizing the magnitude of change over time.
  • Stacked area charts: can be used to show multiple data series.
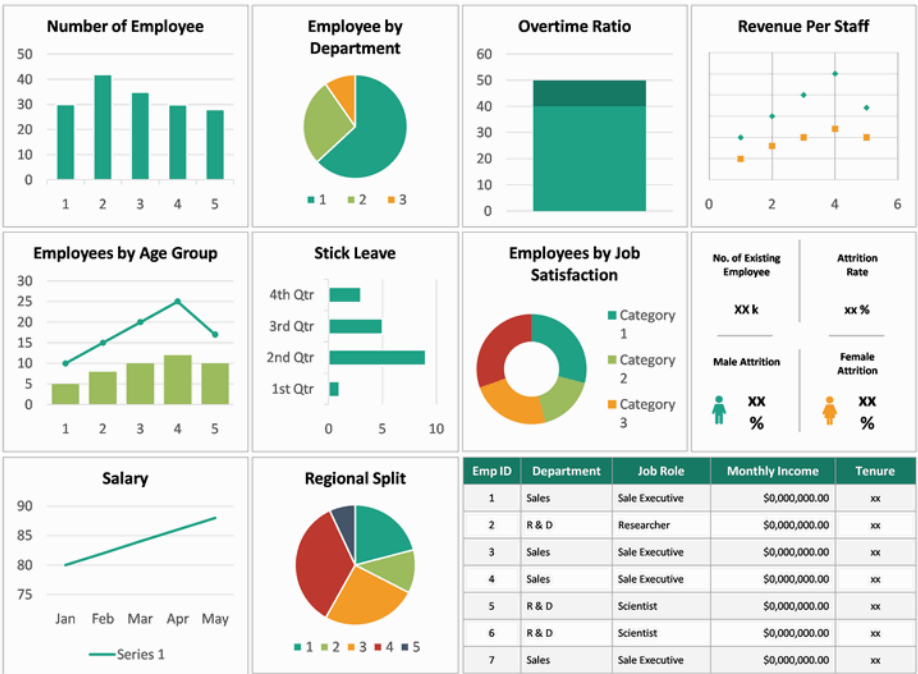
Data Engineering Process Fundamentals - Unlocking Insights: Data Analysis and Visualization - BI Basic Charts

Data Visualization - Code Centric

Python, coupled with libraries like Plotly, Seaborn offers a versatile platform for data visualization that comes with its own set of advantages and limitations. Great for team sharing but, it is heavy in code and deployments tasks.
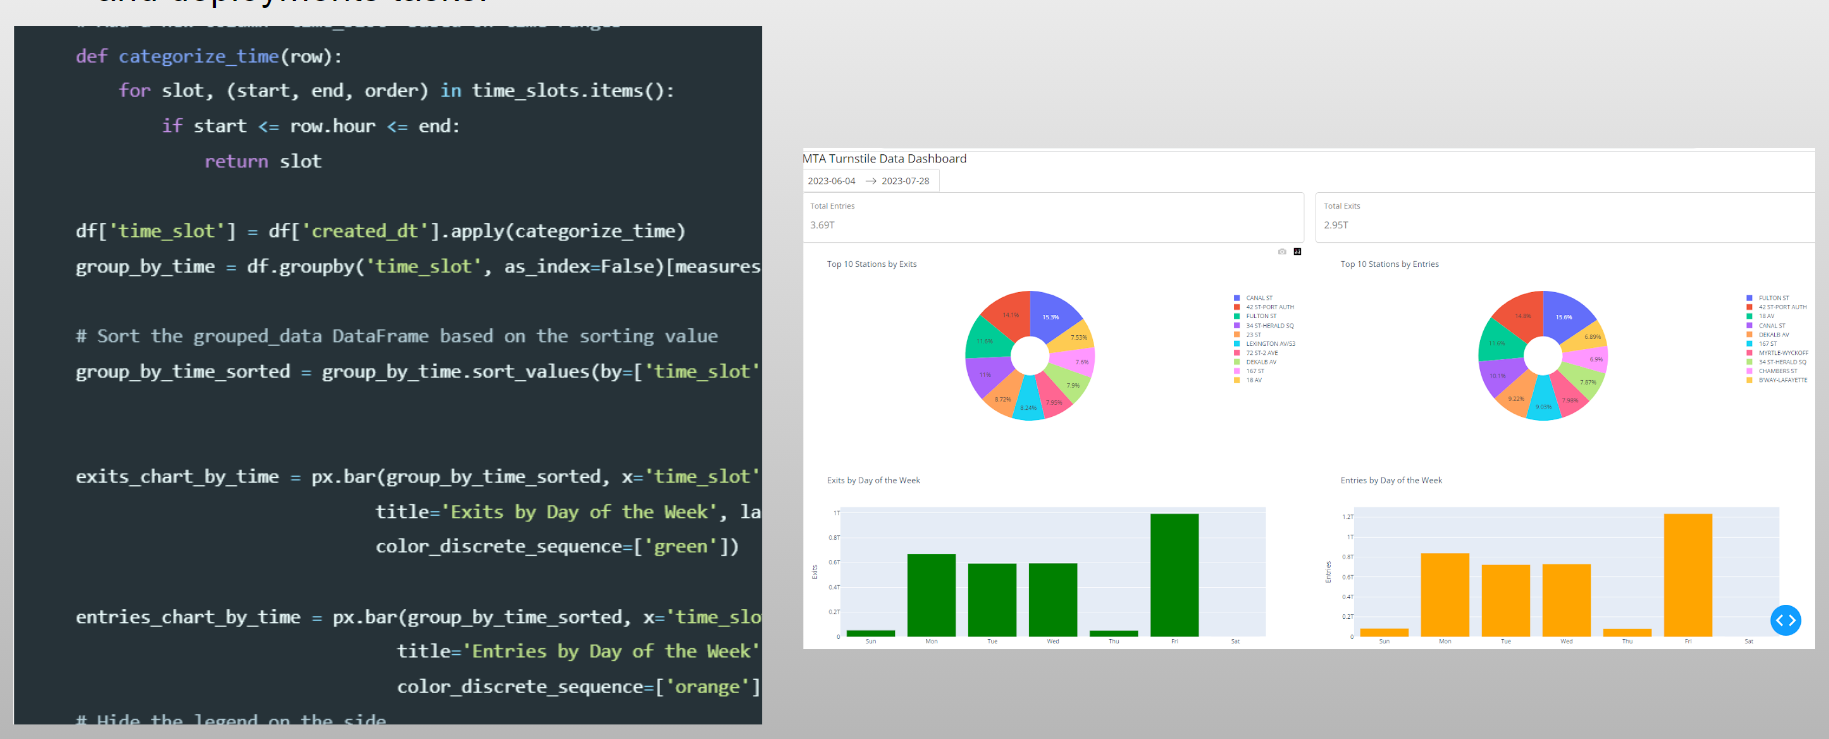
Data Engineering Process Fundamentals - Unlocking Insights: Data Analysis and Visualization - Code Centric Charts

Data Visualization - Low Code

Instead of focusing on code, a low-code tool enables data professionals to focus on the data by using design tools with prebuilt components and connectors. The hosting and deployment is mostly managed by the providers. This is often the solution for broader sharing and enterprise solutions.
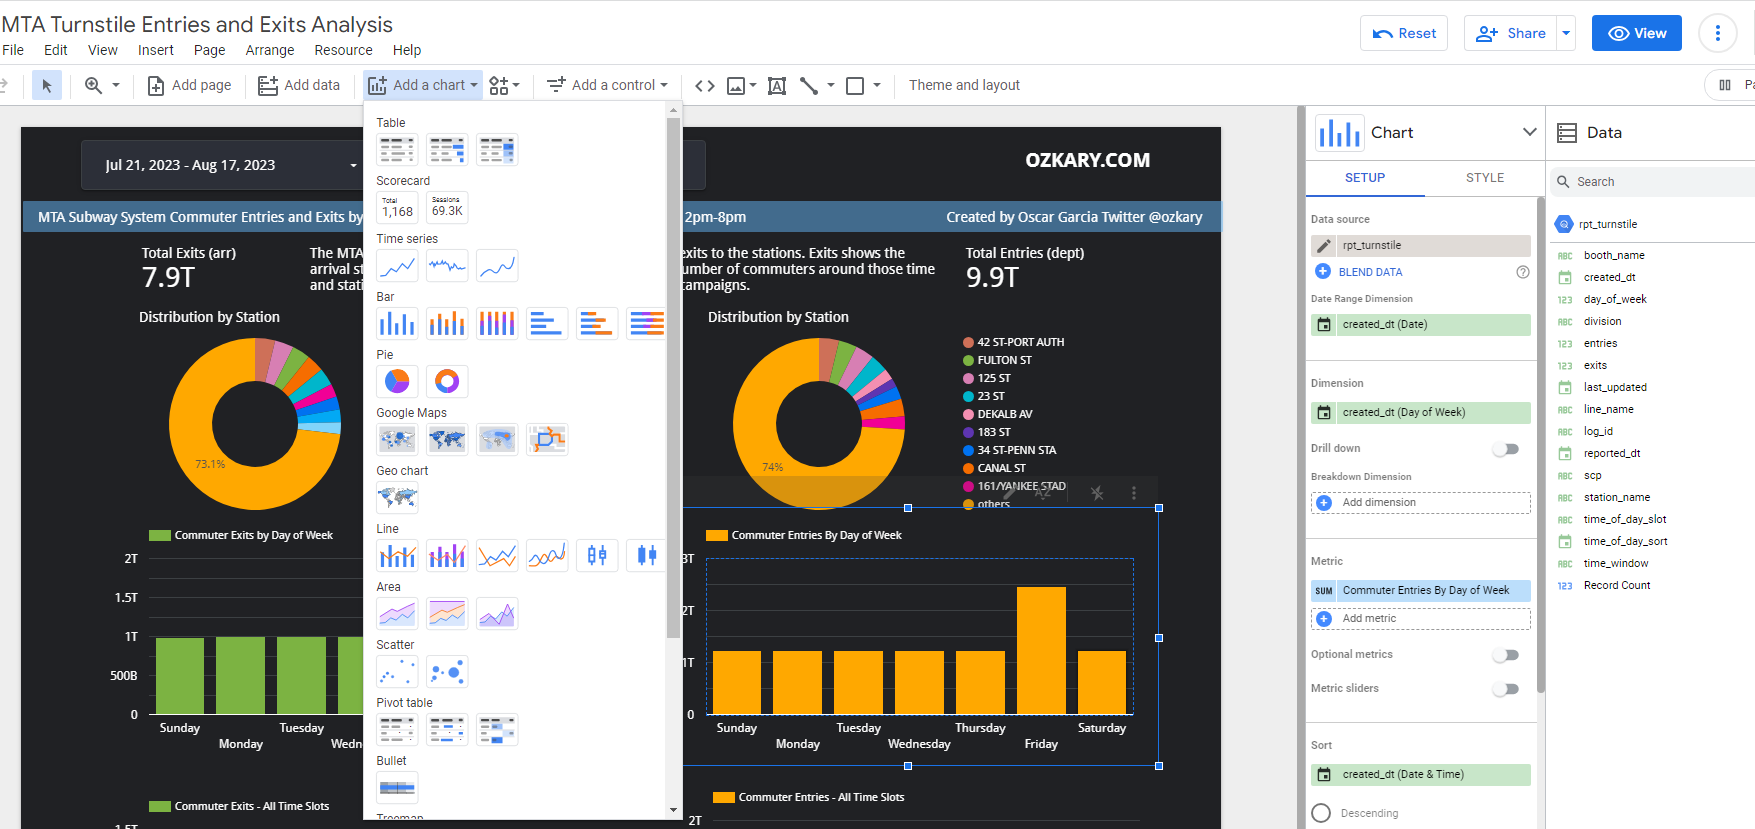
Data Engineering Process Fundamentals - Unlocking Insights: Data Analysis and Visualization - Looker Studio Designer

Final Thoughts

The synergy between data analysis and visualization is pivotal for data-driven projects. Navigating data analysis with established principles and communicating insights through visually engaging dashboards empowers us to extract value from data.

Data Engineering Process Fundamentals - Unlocking Insights: Data Analysis and Visualization - AR Dashboard

The Future is Bright

  • Augmented Reality (AR) and Virtual Reality (VR): Imagine exploring a dataset within a 3D environment & having charts and graphs overlaid on the real world
  • (AI) and Machine Learning (ML): AI can automate data analysis tasks like identifying patterns and trends, while ML can personalize visualizations based on user preferences or past interactions.
  • Tools will focus on creating visualizations that are accessible to people with disabilities

We've covered a lot today, but this is just the beginning!

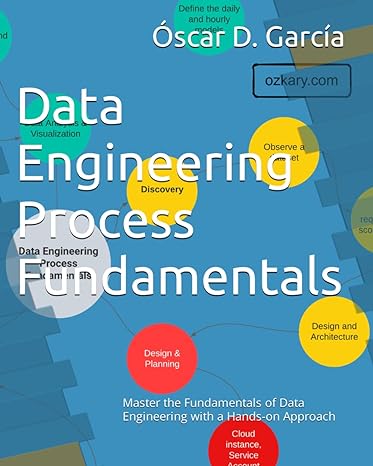
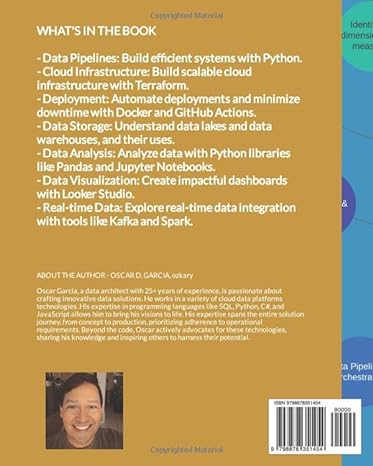
If you're interested in learning more about building cloud data pipelines, I encourage you to check out my book, 'Data Engineering Process Fundamentals,' part of the Data Engineering Process Fundamentals series. It provides in-depth explanations, code samples, and practical exercises to help in your learning.

Data Engineering Process Fundamentals - Book by Oscar Garcia Data Engineering Process Fundamentals - Book by Oscar Garcia

Thanks for reading.

Send question or comment at Twitter @ozkary 👍 Originally published by ozkary.com

5/4/24

Streamlining Data Flow: Building Cloud-Based Data Pipelines - Data Engineering Process Fundamentals

Overview

Delve into the world of cloud-based data pipelines, the backbone of efficient data movement within your organization. As a continuation of our Data Engineering Process Fundamentals series, this session equips you with the knowledge to build robust and scalable data pipelines leveraging the power of the cloud. Throughout this presentation, we'll explore the benefits of cloud-based solutions, delve into key design considerations, and unpack the process of building and optimizing your very own data pipeline in the cloud.

Data Engineering Process Fundamentals - Data Warehouse Design

  • Follow this GitHub repo during the presentation: (Give it a star)

👉 https://github.com/ozkary/data-engineering-mta-turnstile

  • Read more information on my blog at:

👉 https://www.ozkary.com/2023/03/data-engineering-process-fundamentals.html

YouTube Video

Video Agenda

About this event

This session guides you through the essential stages of building a cloud-based data pipeline:

Agenda:

Discovery: We'll embark on a journey of discovery, identifying data sources, understanding business needs, and defining the scope of your data pipeline.

Design and Planning: Here, we'll transform insights into a well-defined blueprint. We'll discuss architecture considerations, data flow optimization, and technology selection for your cloud pipeline.

Data Pipeline and Orchestration: Get ready to orchestrate the magic! This stage delves into building the pipeline itself, selecting the right tools, and ensuring seamless data movement between stages.

Data Modeling and Data Warehouse: Data needs a proper home! We'll explore data modeling techniques and the construction of a robust data warehouse in the cloud, optimized for efficient analysis.

Data Analysis and Visualization: Finally, we'll unlock the power of your data. Learn how to connect your cloud pipeline to tools for insightful analysis and compelling data visualizations.

Why Watch:

Process Power: Learn a structured, process-oriented approach to building and managing efficient cloud data pipelines.

Data to Insights: Discover how to unlock valuable information from your data using Python for data analysis.

The Art of Visualization: Master the art of presenting your data insights through compelling data visualizations.

Future-Proof Your Skills: Gain in-demand cloud data engineering expertise, including data analysis and visualization techniques.

This session equips you with the knowledge and practical skills to build a data pipelines, a crucial skill for data-driven organizations. You'll not only learn the "how" but also the "why" behind each step, empowering you to confidently design, implement, and analyze data pipelines that drive results.

Video Chapters:

0:00:00 Welcome to Data Engineering Process Fundamentals 0:02:19 Phase 1: Discovery 0:19:30 Phase 2: Design and Planning 0:33:30 Phase 3: Data Pipeline and Orchestration 0:49:00 Phase 4: Data Modeling and Data Warehouse 0:59:00 Phase 5: Data Analysis and Visualization 1:01:00 Final Thoughts

Presentation

Data Engineering Overview

A Data Engineering Process involves executing steps to understand the problem, scope, design, and architecture for creating a solution. This enables ongoing big data analysis using analytical and visualization tools.

Data Engineering Process Fundamentals - Operational Data

Process Phases:

  • Discovery
  • Design and Planning
  • Data Pipeline and Orchestration
  • Data Modeling and Data Warehouse
  • Data Analysis and Visualization

Follow this project: Star/Follow the project

👉 Data Engineering Process Fundamentals

Phase 1: Discovery Process

The discovery process involves identifying the problem, analyzing data sources, defining project requirements, establishing the project scope, and designing an effective architecture to address the identified challenges.

Activities include:

  • Background & problem statement: Clearly document and understand the challenges the project aims to address.
  • Exploratory Data Analysis (EDA): Make observations about the data, its structure, and sources.
  • Define Project Requirements based on the observations, enabling the team to understand the scope and goals.
  • Scope of Work: Clearly outline the scope, ensuring a focused and well-defined set of objectives.
  • Set the Stage by selecting tools and technologies that are needed.
  • Design and Architecture: Develop a robust design and project architecture that aligns with the defined requirements and scope.

Data Engineering Process Fundamentals - Phase 1: Discovery

Phase 2: Design and Planning

The design and planning phase of a data engineering project is crucial for laying out the foundation of a successful and scalable solution. This phase ensures that the architecture is strategically aligned with business objectives, optimizes resource utilization, and mitigates potential risks.

Foundational Areas

  • Designing the data pipeline and technology specifications like flows, coding language, data governance and tools
  • Define the system architecture with cloud services for scalability like data lakes & warehouse, orchestration.
  • Source control and deployment automation with CI/CD
  • Using Docker containers for environment isolation to avoid deployment issues
  • Infrastructure automation with Terraform or cloud CLI tools
  • System monitor, notification and recovery to support operations

Data Engineering Process Fundamentals - Phase 2: Design and Planning

Phase 3: Data Pipeline and Orchestration

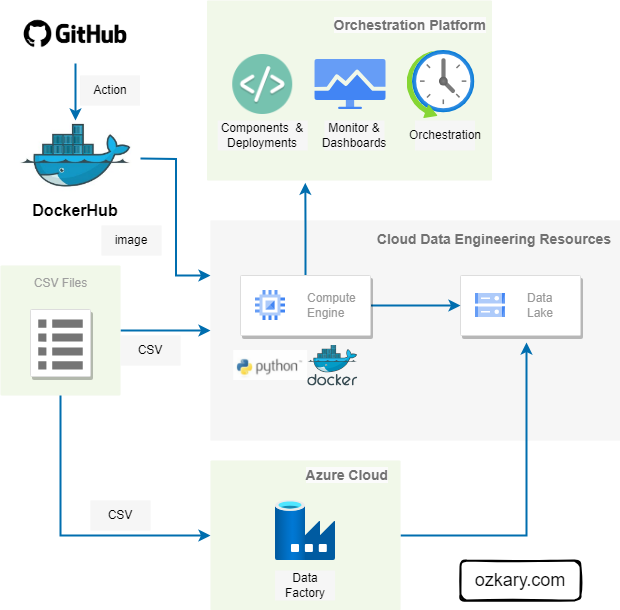
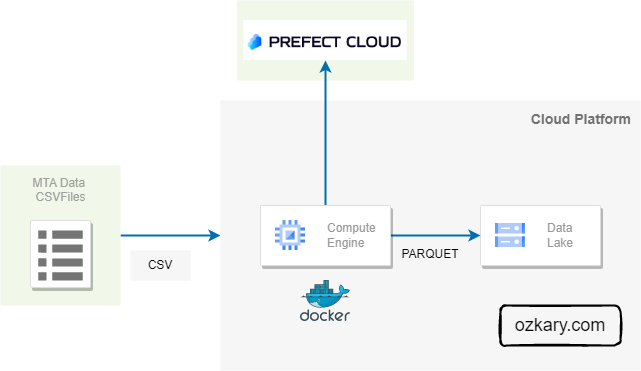
A data pipeline is basically a workflow of tasks that can be executed in Docker containers. The execution, scheduling, managing and monitoring of the pipeline is referred to as orchestration. In order to support the operations of the pipeline and its orchestration, we need to provision a VM and data lake.

Data Engineering Process Fundamentals - Phase 3: Data Pipeline and Orchestration

Process:

  • Get Data In: Ingest data from various sources (databases, APIs, files). Decide to get it all at once (batch) or continuously (streaming).
  • Clean & Format Data: Ensure data quality and consistency. Get it ready for analysis in the right format.
  • Code or No-Code: Use code (Python, SQL) or pre-built solutions.
  • Run The Pipeline: Schedule tasks and run the pipeline. Track its performance to find issues.
  • Store Data in the Cloud: Use data lakes (staging) for raw data and data warehouses for structured, easy-to-analyze data.
  • Deploy Easily: Use containers (Docker) to deploy the pipeline anywhere.
  • Monitor & Maintain: Track how the pipeline runs, fix problems, and keep it working smoothly.

Phase 4: Data Modeling and Data Warehouse

Data Engineering Process Fundamentals - Phase 4: Data Modeling and Data Warehouse

Data Lake - Analytical Data Staging

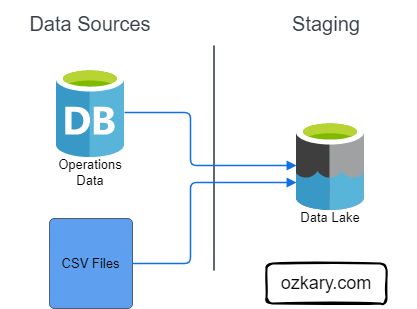
A Data Lake is an optimized storage system for Big Data scenarios. The primary function is to store the data in its raw format without any transformation. Analytical data is the data that has been extracted from a source system via a data pipeline as part of the staging data process.

Features:

  • Store the data in its raw format without any transformation
  • This can include structure data like CSV files, unstructured data like JSON and XML documents, or column-base data like parquet files
  • Low Cost for massive storage power
  • Not Designed for querying or data analysis
  • It is used as external tables by a data warehouse system

Data Engineering Process Fundamentals - Phase 4: Data Lake - Analytical Data Staging

Data Warehouse - Staging to Analytical Data

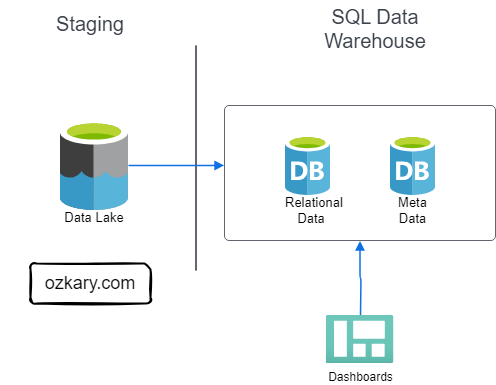
A Data Warehouse, Online Analytical Processing (OLAP) system, is a centralized storage system that stores integrated data from multiple sources. The system is designed to host and serve Big Data scenarios with lower operational cost than transaction databases, but higher costs than a Data Lake.

Features:

  • Stores historical data in relational tables with an optimized schema, which enables the data analysis & visualization process
  • Provides SQL support to query and transform the data
  • Integrates external resources on Data Lakes as external tables
  • The system is designed to host and serve Big Data scenarios.
  • Storage is more expensive
  • Offloads archived data to Data Lakes

Data Engineering Process Fundamentals - Phase 4: Data Warehouse - Staging to Analytical Data

Phase 5: Data Analysis and Visualization

Data Engineering Process Fundamentals - Phase 5: Data Analysis and Visualization

How Do We Gather Insights From Data?

We leverage the principles of data analysis and visualization. Data analysis reveals patterns and trends, while visualization translates these insights into clear charts and graphs. It's the approach to turning raw data into actionable insights for smarter decision-making.

Let’s Explore More About:

  • Data Analysis
    • Python and Jupyter Notebook
  • Data Visualization
    • Chart Types and Design Principles
    • Code-centric with Python Graphs
    • Low-code with tools like Looker, PowerBI, Tableau

Data Analysis - Exploring Data

Data analysis is the practice of exploring data and understanding its meaning. It involves activities that can help us achieve a specific goal, such as identifying data dimensions and measures, as well as the process to identify outliers, trends, and distributions.

Methods:

  • We can accomplish these activities by writing code using Python and Pandas, SQL, Jupyter Notebooks.
  • We can use libraries, such as Plotly, to generate some visuals to further analyze data and create prototypes.
  • The use of low-code tools also aids in the Exploratory Data Analysis (EDA) process by modeling data and using code snippets

Data Engineering Process Fundamentals - Phase 5: Data Analysis and Visualization Code

Data Visualization - Unlock Insights

Data visualization is a practice that takes the insights derived from data analysis and presents them in a visual format. While tables with numbers on a report provide raw information, visualizations allow us to grasp complex relationships and trends at a glance with the use of charts, controls and colors.

Data Engineering Process Fundamentals - Phase 5: Data Analysis and Visualization Dashboard

Visualization Solutions:

  • A code-centric solution involves writing programs with a language like Python, JavaScript to manage the data analysis and create the visuals

  • A low-code solution uses cloud-hosted tools like Looker, PowerBI and Tableau to accelerate the data analysis and visualization by using a design approach

Summary

Throughout this session, we've explored the key stages of building a powerful cloud-based data pipeline. From identifying data sources and understanding business needs (Discovery) to designing an optimized architecture (Design & Planning), building the pipeline itself (Data Pipeline & Orchestration), and finally constructing a robust data warehouse for analysis (Data Modeling & Data Warehouse), we've equipped you with the knowledge to streamline your data flow.

By connecting your cloud pipeline to data analysis and visualization tools, you'll unlock the true power of your data, enabling you to translate insights into clear, actionable information.

We've covered a lot today, but this is just the beginning!

If you're interested in learning more about building cloud data pipelines, I encourage you to check out my book, 'Data Engineering Process Fundamentals,' part of the Data Engineering Process Fundamentals series. It provides in-depth explanations, code samples, and practical exercises to help in your learning.

Data Engineering Process Fundamentals - Book by Oscar Garcia Data Engineering Process Fundamentals - Book by Oscar Garcia

Thanks for reading.

Send question or comment at Twitter @ozkary 👍 Originally published by ozkary.com
4/24/24

Generative AI: Create Code from GitHub User Stories - Large Language Models

Overview

This presentation explores the potential of Generative AI, specifically Large Language Models (LLMs), for streamlining software development by generating code directly from user stories written in GitHub. We delve into benefits like increased developer productivity and discuss techniques like Prompt Engineering and user story writing for effective code generation. Utilizing Python and AI, we showcase a practical example of reading user stories, generating code, and updating the corresponding story in GitHub, demonstrating the power of AI in streamlining software development.

#BuildwithAI Series

Generative AI: Create Code from GitHub User Stories - LLM

  • Follow this GitHub repo during the presentation: (Give it a star and follow the project)

👉 https://github.com/ozkary/ai-engineering

  • Read more information on my blog at:

YouTube Video

Video Agenda

Agenda:

  • Introduction to LLMs and their Role in Code Generation
  • Prompt Engineering - Guiding the LLM
  • Writing User Stories for Code Generation
  • Introducing Gemini AI and AI Studio
  • Python Implementation - A Practical Example using VS Code
    • Reading user stories from GitHub.
    • Utilizing Gemini AI to generate code based on the user story.
    • Updating the corresponding GitHub user story with the generated code.
  • Conclusion: Summarize the key takeaways of the article, emphasizing the potential of Generative AI in code creation.

Why join this session?

  • Discover how Large Language Models (LLMs) can automate code generation, saving you valuable time and effort.
  • Learn how to craft effective prompts that guide LLMs to generate the code you need.
  • See how to write user stories that bridge the gap between human intent and AI-powered code creation.
  • Explore Gemini AI and AI Studio
  • Witness Code Generation in Action: Experience a live demonstration using VS Code, where user stories from GitHub are transformed into code with the help of Gemini AI.

Presentation

What are LLM Models - Not Skynet

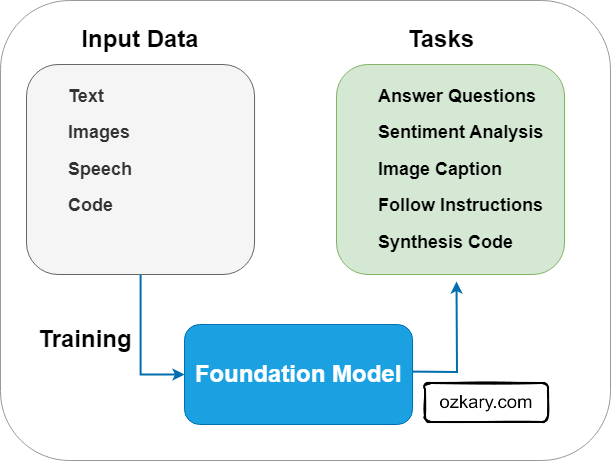
Large Language Model (LLM) refers to a class of Generative AI models that are designed to understand prompts and questions and generate human-like text based on large amounts of training data. LLMs are built upon Foundation Models which have a focus on language understanding.

Common Tasks

  • Text and Code Generation: LLMs can generate code snippets or even entire programs based on specific requirements

  • Natural Language Processing (NLP): Understand and generate human language, sentiment analysis, translation

  • Text Summarization: LLMs can condense lengthy pieces of text into concise summaries

  • Question Answering: LLMs can access and process information from various sources to answer questions, making a great fit for chatbots

Generative AI: Foundation Models

Training LLM Models - Secret Sauce

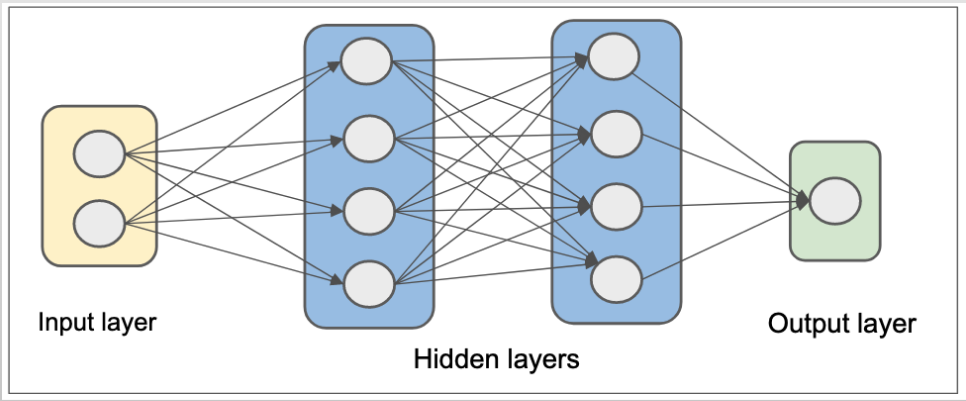
Models are trained using a combination of machine learning and deep learning. Massive datasets of text and code are collected, cleaned, and fed into complex neural networks with multiple layers. These networks iteratively learn by analyzing patterns in the data, allowing them to map inputs like user stories to desired outputs such as code generation.

Training Process:

  • Data Collection: Sources from books, articles, code repositories, and online conversations

  • Preprocessing: Data cleaning and formatting for the ML algorithms to understand it effectively

  • Model Training: The neural network architecture is trained on the data. The network adjusts its internal parameters to learn how to map input data (user stories) to desired outputs (code snippets)

  • Fine-tuning: Fine-tune models for specific tasks like code generation, by training the model on relevant data (e.g., specific programming languages, coding conventions).

Generative AI: Neural-Network

Transformer Architecture - Not Autobots

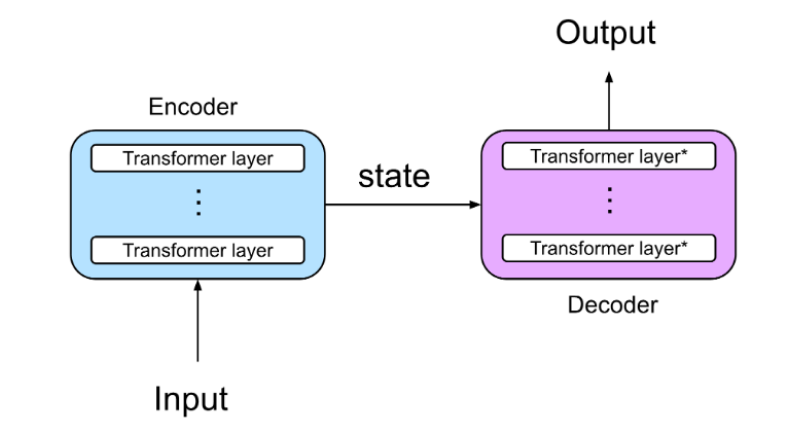
Transformer is a neural network architecture that excels at processing long sequences of text by analyzing relationships between words, no matter how far apart they are. This allows LLMs to understand complex language patterns and generate human-like text.

Components

  • Encoder: Process the input (use story) by using multiple encoder layers with self-attention Mechanism to analyze the relationship between words

  • Decoder: Uses the encoded information and its own attention mechanism to generate the output text (like code), ensuring it aligns with the text.

  • Attention Mechanism: Enables the model to effectively focus on the most important information for the task at hand, leading to improved NLP and generation capabilities.

Generative AI: Transformers encoder decoder attention mechanism

👉 Read: Attention is all you need by Google, 2017

Prompt Engineering - What is it?

Prompt engineering is the process of designing and optimizing prompts to better utilize LLMs. Well described prompts can help the AI models better understand the context and generate more accurate responses.

Features

  • Clarity and Specificity: Effective prompts are clear, concise, and specific about the task or desired response

  • Task Framing: Provide background information, specifying the desired output format (e.g., code, email, poem), or outlining specific requirements

  • Examples and Counter-Examples: Including relevant examples and counterexamples within the prompt can further guide the LLM

  • Instructional Language: Use clear and concise instructions to improve the LLM's understanding of what information to generate

User Story Prompt:

As a web developer, I want to create a React component with TypeScript for a login form that uses JSDoc for documentation, hooks for state management, includes a "Remember This Device" checkbox, and follows best practices for React and TypeScript development so that the code is maintainable, reusable, and understandable for myself and other developers, aligning with industry standards.

Needs:

- Component named "LoginComponent" with state management using hooks (useState)
- Input fields:
    - ID: "email" (type="email") - Required email field (as username)
    - ID: "password" (type="password") - Required password field
- Buttons:
    - ID: "loginButton" - "Login" button
    - ID: "cancelButton" - "Cancel" button
- Checkbox:
    - ID: "rememberDevice" - "Remember This Device" checkbox

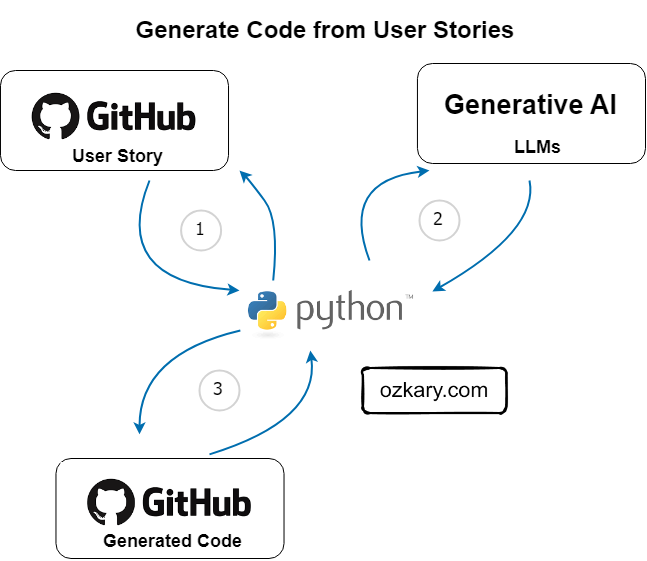
Generate Code from User Stories - Practical Use Case

In the Agile methodology, user stories are used to capture requirements, tasks, or a feature from the perspective of a role in the system. For code generation, developers can write user stories to capture the context, requirements and technical specifications necessary to generate code with AI.

Code Generation Flow:

  • 1 User Story: Get the GitHub tasks with user story information

  • 2 LLM Model: Send the user story as a prompt to the LLM Model

  • 3 Generated Code: Send the generated code back to GitHub as a comment for a developer to review

👉 LLM generated code is not perfect, and developers should manually review and validate the generated code.

Generative AI: Generate Code Flow

How does LLMs Impact Development?

LLMs accelerate development by generating code faster, leading to shorter development cycles. They also automate documentation and empower exploration of complex algorithms, fostering innovation.

Features:

  • Code Completion: Analyze your code and suggest completions based on context

  • Code Synthesis: Describe what you want the code to do, and the LLM can generate the code

  • Code Refactoring: Analyze your code and suggest improvements for readability, performance, or best practices.

  • Documentation: Generate documentation that explains your code's purpose and functionality

  • Code Translation: Translate code snippets between different programming languages

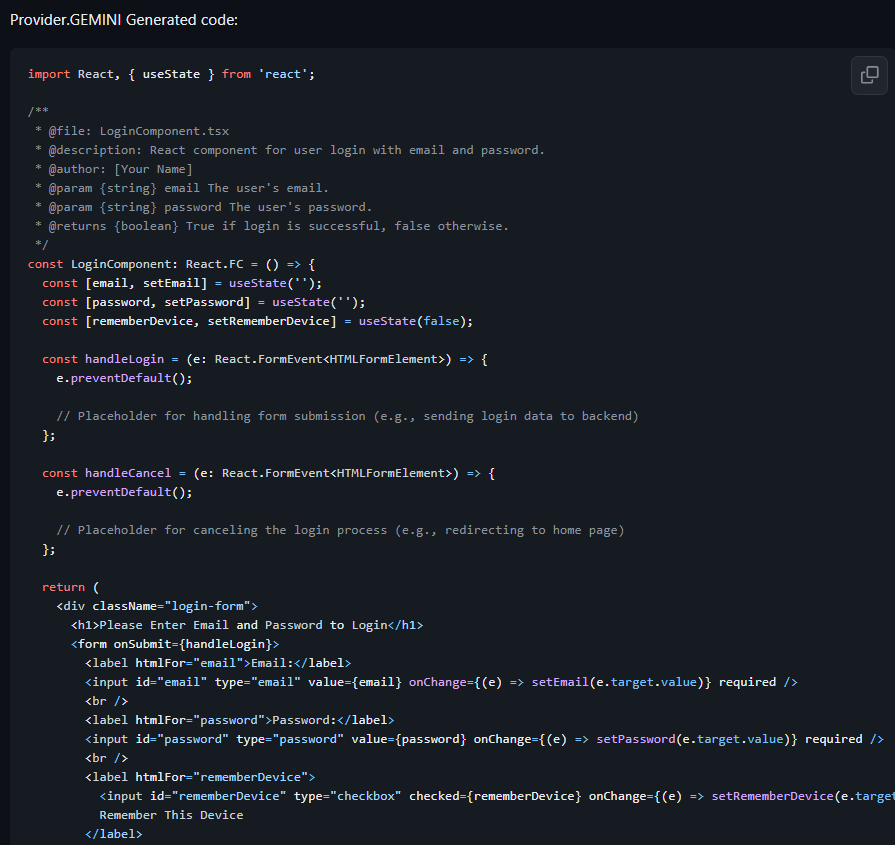
Generative AI: React Code Generation

👉 Security Concerns: Malicious actors could potentially exploit LLMs to generate harmful code.

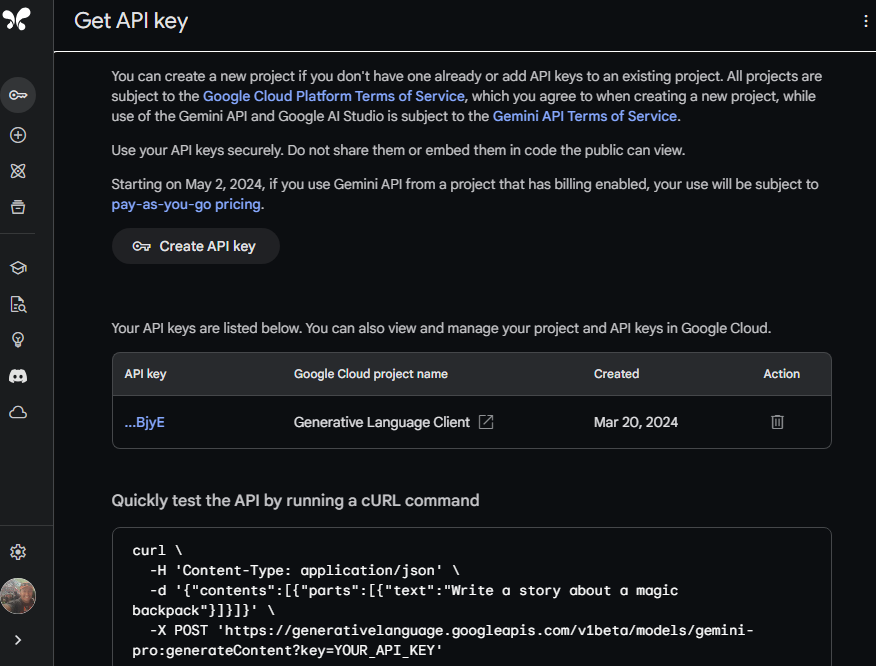
What is Gemini AI?

Gemini is Google's next-generation large language model (LLM), unlocking the potential of Generative AI. This powerful tool understands and generates various data formats, from text and code to images and audio.

Components:

  • Gemini: Google's next-generation multimodal LLM, capable of understanding and generating various data formats (text, code, images, audio)

  • Gemini API: Integrate Gemini's into your applications with a user-friendly API

  • Google AI Studio: A free, web-based platform for prototyping with Gemini aistudio.google.com

    • Experiment with prompts and explore Gemini's capabilities
      • Generate creative text formats, translate languages
    • Export your work to code for seamless integration into your projects

Generative AI: Google AI Studio

👉 Multimodal LLMs can handle text, images, video, code

Generative AI for Development Summary

LLM plays a crucial role in code generation by harnessing its language understanding and generative capabilities. People in roles like developers, data engineers, scientists and others can utilize AI models to swiftly generate scripts in various programming languages, streamlining their programming tasks.

Common Tasks:

  • Code generation
  • Natural Language Processing (NLP)
  • Text summarization
  • Question answering

Architecture:

  • Multi-layered neural networks
  • Training process

    Transformer Architecture:

  • Encoder-Decoder structure
  • Attention mechanism

Prompt Engineering:

  • Crafting effective prompts with user stories

    Code Generation from User Stories:

    • Leveraging user stories for code generation

Thanks for reading.

Send question or comment at Twitter @ozkary

👍 Originally published by ozkary.com
4/3/24

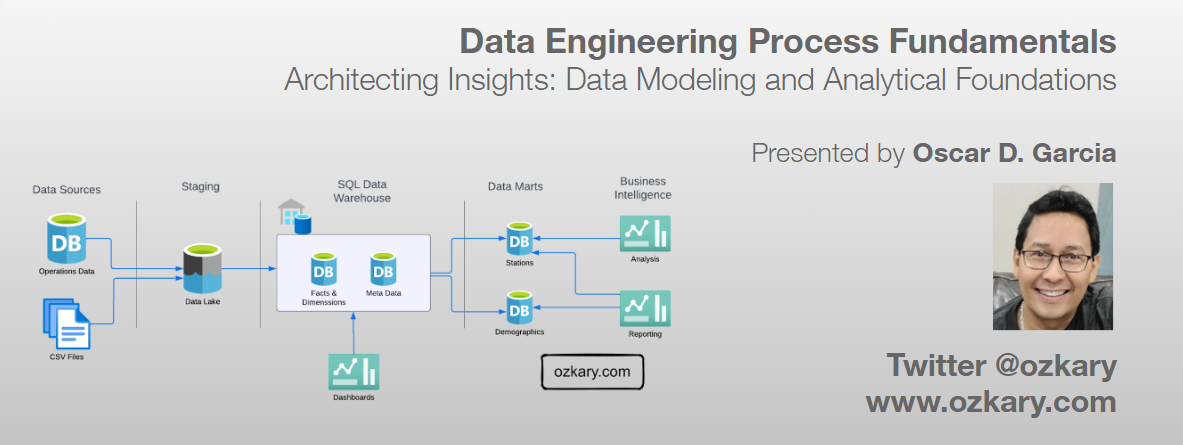
Architecting Insights: Data Modeling and Analytical Foundations - Data Engineering Process Fundamentals

Overview

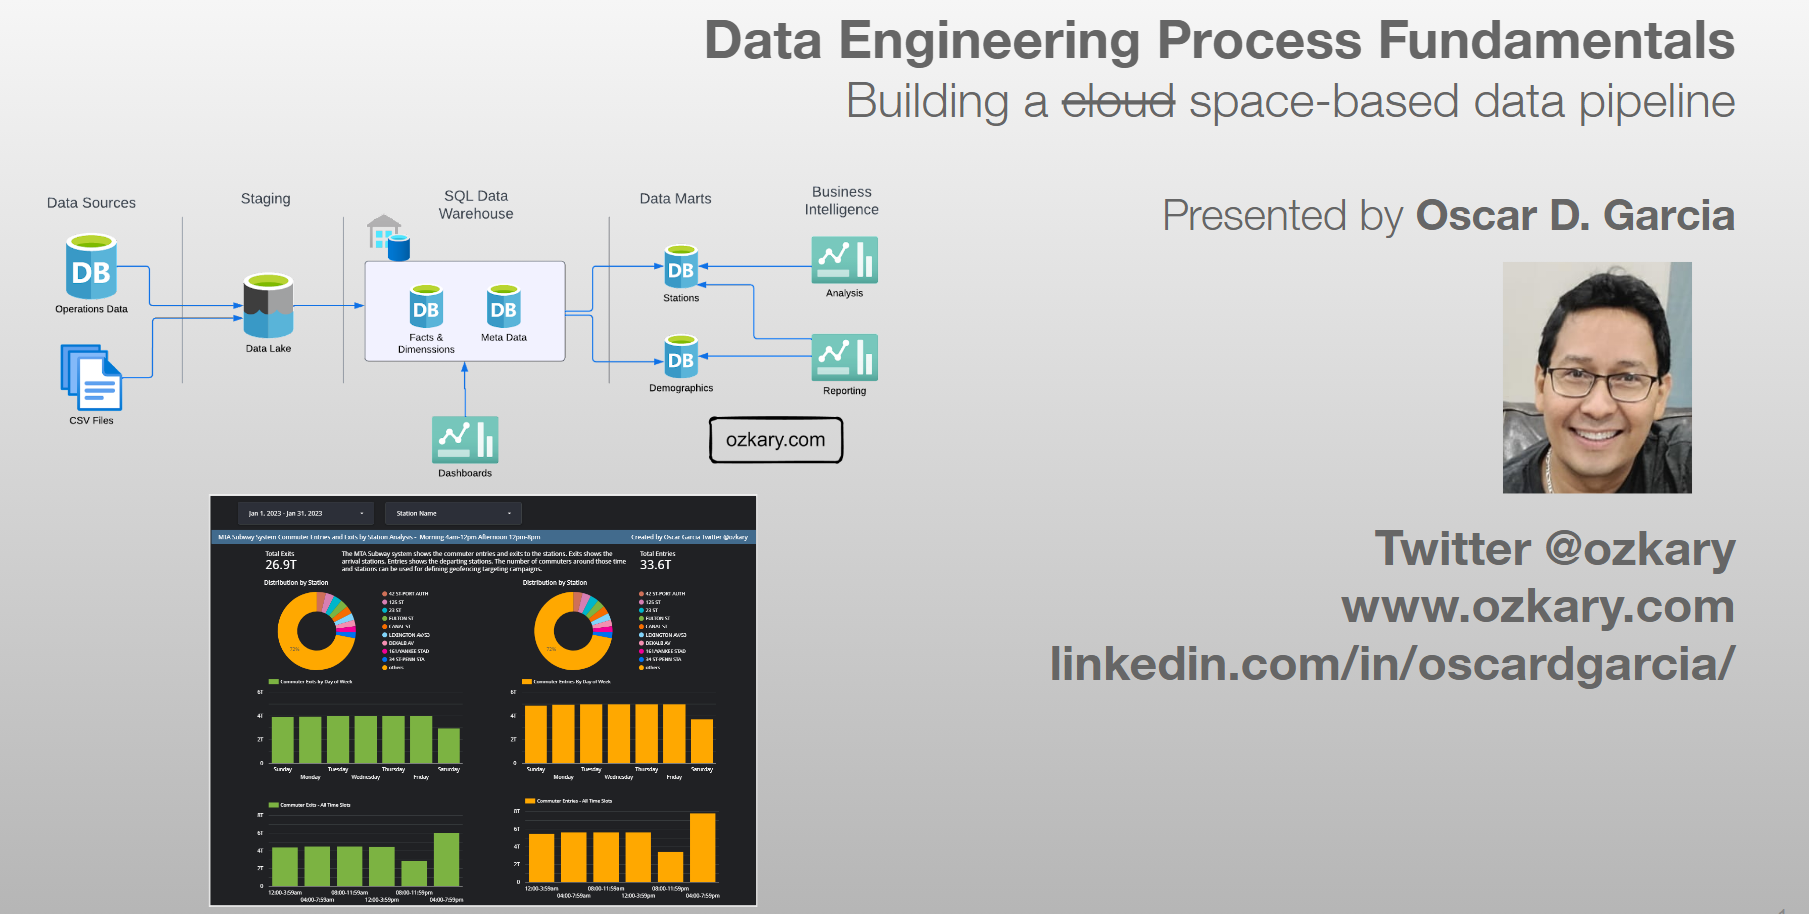
A Data Warehouse is an OLAP system, which serves as the central data repository for historical and aggregated data. A data warehouse is designed to support complex analytical queries, reporting, and data analysis for Big Data use cases. It typically adopts a denormalized entity structure, such as a star schema or snowflake schema, to facilitate efficient querying and aggregations. Data from various OLTP sources is extracted, loaded and transformed (ELT) into the data warehouse to enable analytics and business intelligence. The data warehouse acts as a single source of truth for business users to obtain insights from historical data.

In this technical presentation, we embark on the next chapter of our data journey, delving into data modeling and building our data warehouse.

Data Engineering Process Fundamentals - Data Warehouse Design

  • Follow this GitHub repo during the presentation: (Give it a star)

👉 https://github.com/ozkary/data-engineering-mta-turnstile

  • Read more information on my blog at:

👉 https://www.ozkary.com/2023/03/data-engineering-process-fundamentals.html

YouTube Video

Video Agenda

Building on our previous exploration of data pipelines and orchestration, we now delve into the pivotal phase of data modeling and analytics. In this continuation of our data engineering process series, we focus on architecting insights by designing and implementing data warehouses, constructing logical and physical models, and optimizing tables for efficient analysis. Let's uncover the foundational principles driving effective data modeling and analytics.

Agenda:

  • Operational Data Concepts:

    • Explanation of operational data and its characteristics.
    • Discussion on data storage options, including relational databases and NoSQL databases.
  • Data Lake for Data Staging:

    • Introduction to the concept of a data lake as a central repository for raw, unstructured, and semi-structured data.
    • Explanation of data staging within a data lake for ingesting, storing, and preparing data for downstream processing.
    • Discussion on the advantages of using a data lake for data staging, such as scalability and flexibility.
  • Data Warehouse for Analytical Data:

    • Overview of the role of a data warehouse in storing and organizing structured data for analytics and reporting purposes.
    • Discussion on the benefits of using a data warehouse for analytical queries and business intelligence.
  • Data Warehouse Design and Implementation:

    • Introduction to data warehouse design principles and methodologies.
    • Explanation of logical models for designing a data warehouse schema, including conceptual and dimensional modeling.
  • Star Schema:

    • Explanation of the star schema design pattern for organizing data in a data warehouse.
    • Discussion on fact tables, dimension tables, and their relationships within a star schema.
    • Explanation of the advantages of using a star schema for analytical querying and reporting.
  • Logical Models:

    • Discussion on logical models in data warehouse design.
    • Explanation of conceptual modeling and entity-relationship diagrams (ERDs).
  • Physical Models - Table Construction:

    • Discussion on constructing tables from the logical model, including entity mapping and data normalization.
    • Explanation of primary and foreign key relationships and their implementation in physical tables.
  • Table Optimization Index and Partitions:

    • Introduction to table optimization techniques for improving query performance.
    • Explanation of index creation and usage for speeding up data retrieval.
    • Discussion on partitioning strategies for managing large datasets and enhancing query efficiency.
  • Incremental Strategy:

    • Introduction to incremental loading techniques for efficiently updating data warehouses.
    • Explanation of delta processing.
    • Discussion on the benefits of incremental loading in reducing processing time and resource usage.
  • Orchestration and Operations:

    • Tools and frameworks for orchestrating data pipelines, such as dbt.
    • Discussion on the importance of orchestration and monitoring the data processing tasks.
    • Policies to archive data in blob storage.

Why join this session?

  • Learn analytical data modeling essentials.
  • Explore schema design patterns like star and snowflake.
  • Optimize large dataset management and query efficiency.
  • Understand logical and physical modeling strategies.
  • Gain practical insights and best practices.
  • Engage in discussions with experts.
  • Advance your data engineering skills.
  • Architect insights for data-driven decisions.

Presentation

Data Engineering Overview

A Data Engineering Process involves executing steps to understand the problem, scope, design, and architecture for creating a solution. This enables ongoing big data analysis using analytical and visualization tools.

Data Engineering Process Fundamentals - Operational Data

Topics

  • Operational Data
  • Data Lake
  • Data Warehouse
  • Schema and Data Modeling
  • Data Strategy and Optimization
  • Orchestration and Operations

Follow this project: Star/Follow the project

👉 Data Engineering Process Fundamentals

Operational Data

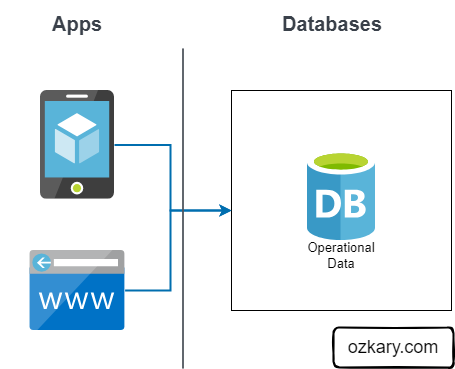
Operational data (OLTP) is often generated by applications, and it is stored in transactional relational databases like SQL Server, Oracle and NoSQL (JSON) databases like CosmosDB, Firebase. This is the data that is created after an application saves a user transaction like contact information, a purchase or other activities that are available from the application.

Features

  • Application support and transactions
  • Relational data structure and SQL or document structure NoSQL
  • Small queries for case analysis

Not Best For:

  • Reporting and analytical systems (OLAP)
  • Large queries
  • Centralized Big Data system

Data Engineering Process Fundamentals - Operational Data

Data Lake - From Ops to Analytical Data Staging

A Data Lake is an optimized storage system for Big Data scenarios. The primary function is to store the data in its raw format without any transformation. Analytical data is the transaction data that has been extracted from a source system via a data pipeline as part of the staging data process.

Features:

  • Store the data in its raw format without any transformation
  • This can include structure data like CSV files, unstructured data like JSON and XML documents, or column-base data like parquet files
  • Low Cost for massive storage power
  • Not Designed for querying or data analysis
  • It is used as external tables by most systems

Data Engineering Process Fundamentals - Data Lake for Staging the data

Data Warehouse - Staging to Analytical Data

A Data Warehouse, OLAP system, is a centralized storage system that stores integrated data from multiple sources. The system is designed to host and serve Big Data scenarios with lower operational cost than transaction databases, but higher costs than a Data Lake.

Features:

  • Stores historical data in relational tables with an optimized schema, which enables the data analysis process
  • Provides SQL support to query and transform the data
  • Integrates external resources on Data Lakes as external tables
  • The system is designed to host and serve Big Data scenarios.
  • Storage is more expensive
  • Offloads archived data to Data Lakes

Data Engineering Process Fundamentals - Data Warehouse Analytical Data

Data Warehouse - Design and Implementation

In the design phase, we lay the groundwork by defining the database system, schema model, logical data models, and technology stack (SQL, Python, frameworks and tools) required to support the data warehouse’s implementation and operations.

In the implementation phase, we focus on converting logical data models into a functional system. By creating concrete structures like dimension and fact tables and performing data transformation tasks, including data cleansing, integration, and scheduled batch loading, we ensure that raw data is processed and unified for analysis.

Data Engineering Process Fundamentals - Data Warehouse Design

Design - Schema Modeling

The Star and Snowflake Schemas are two common data warehouse modeling techniques. The Star Schema consist of a central fact table is connected to multiple dimension tables via foreign key relationships. The Snowflake Schema is a variation of the Star Schema, but with dimension tables that are further divided into multiple related tables.

What to use:

  • Use the Star Schema when query performance is a primary concern, and data model simplicity is essential

  • Use the Snowflake Schema when storage optimization is crucial, and the data model involves high-cardinality dimension attributes with potential data redundancy

Data Engineering Process Fundamentals - Data Warehouse Schema Model

Data Modeling

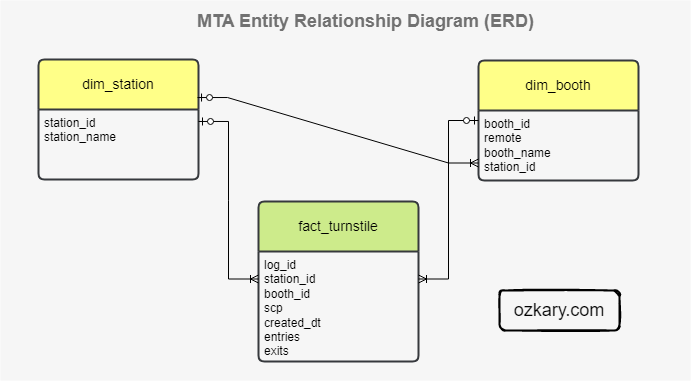
Data modeling lays the foundation for a data warehouse. It starts with modeling raw data into a logical model outlining the data and its relationships, with a focus based on data requirements. This model is then translated, using DDL, into the specific views, tables, columns (data types), and keys that make up the physical model of the data warehouse, with a focus on technical requirements.

Data Engineering Process Fundamentals - Data Warehouse Data Model

Data Optimization to Deliver Performance

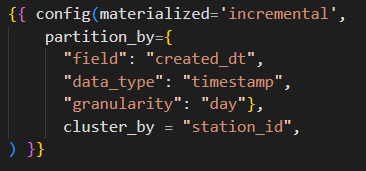
To achieve faster queries, improve performance and reduce resource cost, we need to efficiently organize our data. Two key techniques for accomplishing this are data partitioning and data clustering.

  • Data Partitioning: Imagine dividing your data table into smaller, self-contained segments based on a specific column (e.g., date). This allows the DW to quickly locate and retrieve only the relevant data for your queries, significantly reducing scan times.

  • Data Clustering: Allows us to organize the data within each partition based on another column (e.g., Station). This groups frequently accessed data together physically, leading to faster query execution, especially for aggregations or filtering based on the clustered column.

Data Engineering Process Fundamentals - Data Warehouse DDL Script

Data Transformation and Incremental Strategy

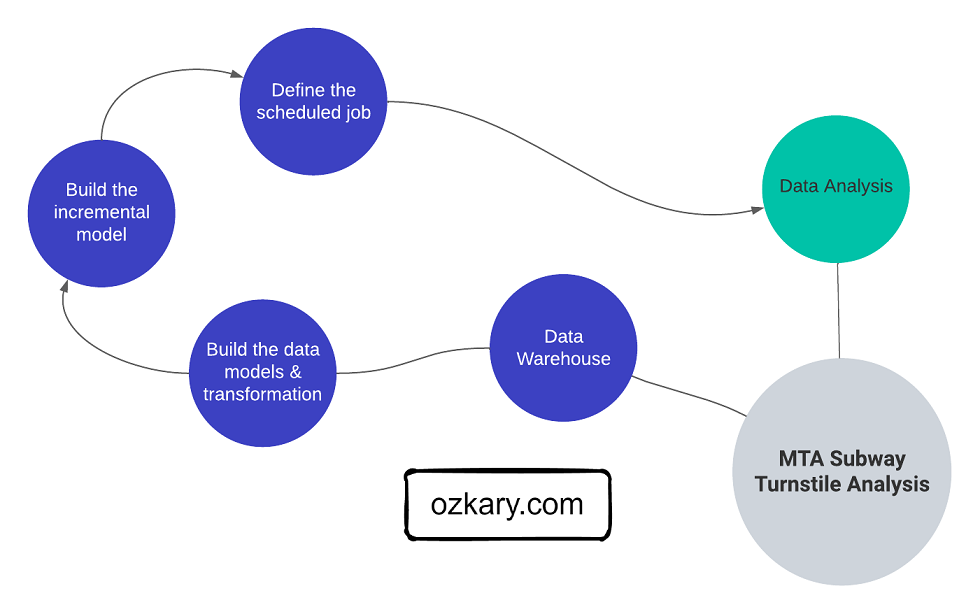
The data transformation phase is a critical stage in a data warehouse project. This phase involves several key steps, including data extraction, cleaning, loading, data type casting, use of naming conventions, and implementing incremental loads to continuously insert the new information since the last update via batch processes.

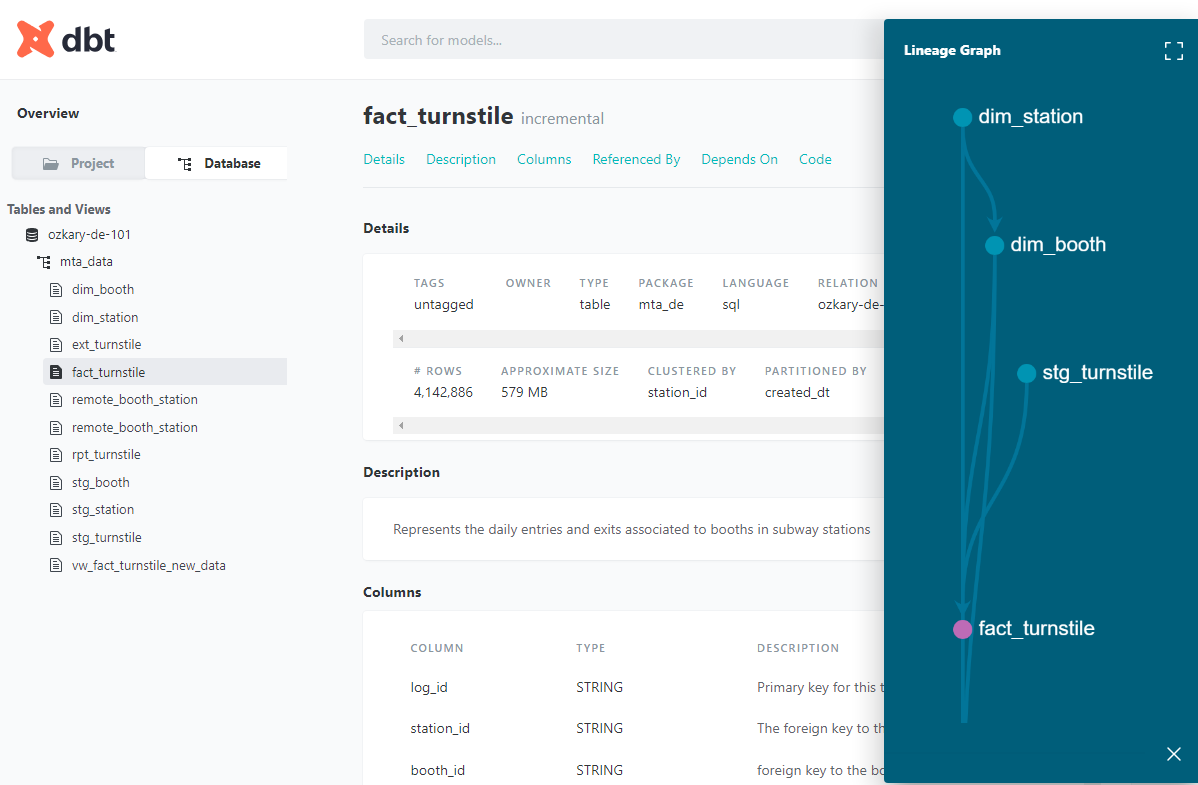
Data Engineering Process Fundamentals - Data Warehouse Data Lineage

  • Data Lineage: Tracks the flow of data from its origin to its destination, including all the intermediate processes and transformations that it undergoes.

Orchestration and Operations

Effective orchestration and operation are the keys of a reliable and efficient data project. They streamline data pipelines, ensure data quality, and minimize human intervention. This translates to faster development cycles, reduced errors, and improved overall data management.

  • Version Control and CI/CD with GitHub: Enables development, automated testing, and seamless deployment of data pipelines.

  • Documentation: Maintain clear and comprehensive documentation covering data pipelines, data quality checks, scheduling, data archiving policies

  • Scheduling and Automation: Automates repetitive tasks, such as data ingestion, transformation, and archiving processes,

  • Monitoring and Notification: Provides real-time insights into pipeline health, data quality, and archiving success

Data Engineering Process Fundamentals - Data Warehouse Data Lineage

Summary

Before we can move data into a data warehouse system, we explore two pivotal phases for our data warehouse solution: design and implementation. In the design phase, we lay the groundwork by defining the database system, schema and data model, and technology stack required to support the data warehouse’s implementation and operations. This stage ensures a solid infrastructure for data storage and management.

In the implementation phase, we focus on converting conceptual data models into a functional system. By creating concrete structures like dimension and fact tables and performing data transformation tasks, including data cleansing, integration, and scheduled batch loading, we ensure that raw data is processed and unified for analysis.

Thanks for reading.

Send question or comment at Twitter @ozkary

👍 Originally published by ozkary.com
3/7/24

Coupling Data Flows: Data Pipelines and Orchestration - Data Engineering Process Fundamentals

Overview

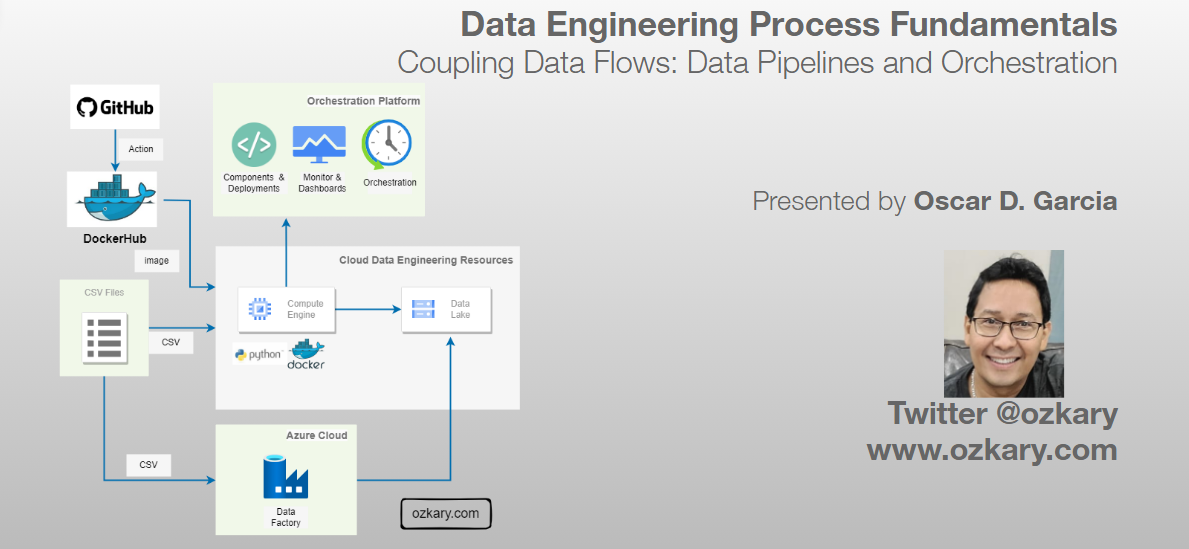
A data pipeline refers to a series of connected tasks that handles the extract, transform and load (ETL) as well as the extract, load and transform (ELT) operations and integration from a source to a target storage like a data lake or data warehouse. Properly designed pipelines ensure data integrity, quality, and consistency throughout the system.

In this technical presentation, we embark on the next chapter of our data journey, delving into building a pipeline with orchestration for ongoing development and operational support.

Data Engineering Process Fundamentals - Data Pipelines

  • Follow this GitHub repo during the presentation: (Give it a star)

👉 https://github.com/ozkary/data-engineering-mta-turnstile

  • Read more information on my blog at:

👉 https://www.ozkary.com/2023/03/data-engineering-process-fundamentals.html

YouTube Video

Video Agenda

  • *Understanding Data Pipelines:"

    • Delve into the concept of data pipelines and their significance in modern data engineering.
  • Implementation Options:

    • Explore different approaches to implementing data pipelines, including code-centric and low-code tools.
  • Pipeline Orchestration:

    • Learn about the role of orchestration in managing complex data workflows and the tools available, such as Apache Airflow, Apache Spark, Prefect, and Azure Data Factory.
  • Cloud Resources:

    • Identify the necessary cloud resources for staging environments and data lakes to support efficient data pipeline deployment.
  • Implementing Flows:

    • Examine the process of building data pipelines, including defining tasks, components, and logging mechanisms.
  • Deployment with Docker:

    • Discover how Docker containers can be used to isolate data pipeline environments and streamline deployment processes.
  • Monitor and Operations:

    • Manage operational concerns related to data pipeline performance, reliability, and scalability.

Key Takeaways:

  • Gain practical insights into building and managing data pipelines.

  • Learn coding techniques with Python for efficient data pipeline development.

  • Discover the benefits of Docker deployments for data pipeline management.

  • Understand the significance of data orchestration in the data engineering process.

  • Connect with industry professionals and expand your network.

  • Stay updated on the latest trends and advancements in data pipeline architecture and orchestration.

Some of the technologies that we will be covering:

  • Cloud Infrastructure
  • Data Pipelines
  • GitHub
  • VSCode
  • Docker and Docker Hub

Presentation

Data Engineering Overview

A Data Engineering Process involves executing steps to understand the problem, scope, design, and architecture for creating a solution. This enables ongoing big data analysis using analytical and visualization tools.

Topics

  • Understanding Data pipelines
  • Implementation Options
  • Pipeline Orchestration
  • Cloud Resources
  • Implementing Code-Centric Flows
  • Deployment with Docker
  • Monitor and Operations

Follow this project: Star/Follow the project

👉 Data Engineering Process Fundamentals

Understanding Data Pipelines

A data pipeline refers to a series of connected tasks that handles the extract, transform and load (ETL) as well as the extract, load and transform (ELT) operations and integration from a source to a target storage like a data lake or data warehouse

Foundational Areas

  • Data Ingestion and Transformation
  • Code-Centric vs. Low-Code Options
  • Orchestration
  • Cloud Resources
  • Implementing flows, tasks, components and logging
  • Deployment
  • Monitoring and Operations

Data Engineering Process Fundamentals - Data Pipeline and Orchestration

Data Ingestion and Transformation

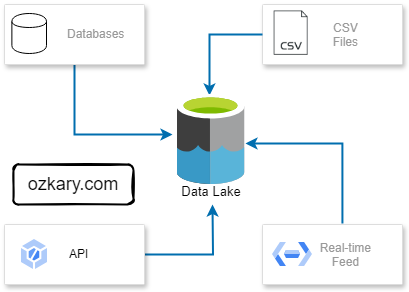
Data ingestion is the process of bringing data in from various sources, such as databases, APIs, data streams and files, into a staging area. Once the data is ingested, we can transform it to match our requirements.

Key Areas:

  • Identify methods for extracting data from various sources (databases, APIs, Data Streams, files, etc.).
  • Choose between batch or streaming ingestion based on data needs and use cases
  • Data cleansing and standardization ensure quality and consistency.
  • Data enrichment adds context and value.
  • Formatting into the required data models for analysis.

Data Engineering Process Fundamentals - Data Pipeline Sources

Implementation Options

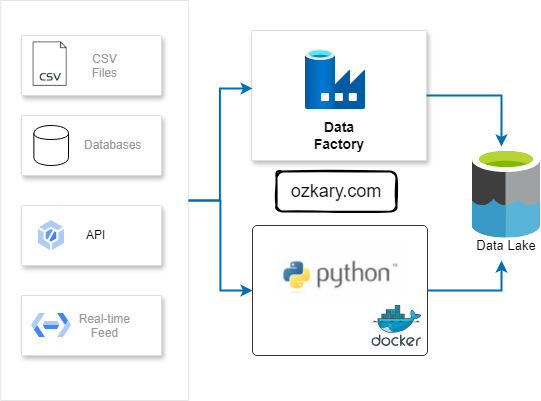
The implementation of a pipeline refers to the designing and/or coding of each task in the pipeline. A task can be implemented using a programming languages like Python or SQL. It can also be implemented using a low-code tool with zero or some code snippet.

Options:

  • Code-centric: Provides flexibility, customization, and full control (Python, SQL, etc.). Ideal for complex pipelines with specific requirements. Requires programming expertise.

  • Low-code: Offers visual drag-and-drop interfaces that allow the engineer to connect to APIs, databases, data lakes and other sources that provide access via API, enabling faster development. (Azure Data Factory, GCP Cloud Dataflow)

Data Engineering Process Fundamentals - Data Pipeline Integration

Pipeline Orchestration

Orchestration is the automation, management and coordination of the data pipeline tasks. It involves the scheduling, workflows, monitoring and recovery of those tasks. The orchestration handles the execution, error handling, retry and the alerting of problems in the pipeline.

Orchestration Tools:

  • Apache Airflow: Offers flexible and customizable workflow creation for engineers using Python code, ideal for complex pipelines.
  • Apache Spark: Excels at large-scale batch processing tasks involving API calls and file downloads with Python. Its distributed framework efficiently handles data processing and analysis.
  • Prefect: This open-source workflow management system allows defining and managing data pipelines as code, providing a familiar Python API.
  • Cloud-based Services: Tools like Azure Data Factory and GCP Cloud Dataflow provide a visual interface for building and orchestrating data pipelines, simplifying development. They also handle logging and alerting.

Data Engineering Process Fundamentals - Data Pipeline Architecture

Cloud Resources

Cloud resources are critical for data pipelines. Virtual machines (VMs) offer processing power for code-centric pipelines, while data lakes serve as central repositories for raw data. Data warehouses, optimized for structured data analysis, often integrate with data lakes to enable deeper insights.

Resources:

  • Code-centric pipelines: VMs are used for executing workflows, managing orchestration, and providing resources for data processing and transformation. Often, code runs within Docker containers.

  • Data Storage: Data lakes act as central repositories for storing vast amounts of raw and unprocessed data. They offer scalable and cost-effective solutions for capturing and storing data from diverse sources.

  • Low-code tools: typically have their own infrastructure needs specified by the platform provider. Provisioning might not be necessary, and the tool might be serverless or run on pre-defined infrastructure.

Data Engineering Process Fundamentals - Data Pipeline Resources

Implementing Code-Centric Flows

In a data pipeline, orchestrated flows define the overall sequence of steps. These flows consist of tasks, which represent specific actions within the pipeline. For modularity and reusability, a task should use components to encapsulate common concerns like security and data lake access.

Pipeline Structure:

  • Flows: Are coordinators that define the overall structure and sequence of the data pipeline. They are responsible for orchestrating the execution of other flows or tasks in a specific order.

  • Tasks: Are operators for each individual units of work within the pipeline. Each task represents a specific action or function performed on the data, such as data extraction, transformation, or loading. They manipulate the data according to the flow's instructions.

  • Components: These are reusable code blocks that encapsulate functionalities common across different tasks. They act as utilities, providing shared functionality like security checks, data lake access, logging, or error handling.

Data Engineering Process Fundamentals - Data Pipeline Monitor

Deployment with Docker and Docker Hub

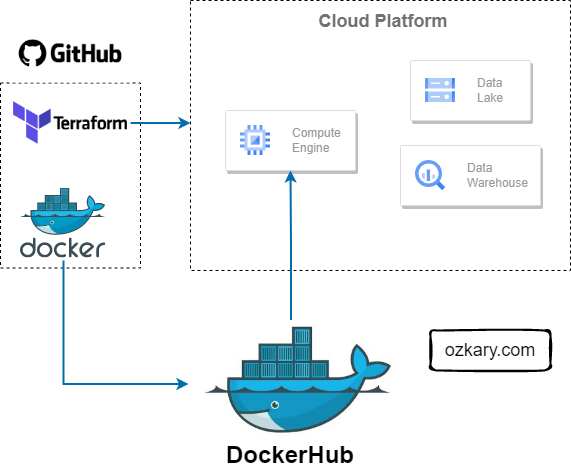
Docker proves invaluable for our data pipelines by providing self-contained environments with all necessary dependencies. With Docker Hub, we can effortlessly distribute pipeline images, facilitating swift and reliable provisioning of new environments.

  • Docker containers streamline the deployment process by encapsulating application and dependency configurations, reducing runtime errors.

  • Containerizing data pipelines ensures reliability and portability by packaging all necessary components within a single container image.

  • Docker Hub serves as a centralized container registry, enabling seamless image storage and distribution for streamlined environment provisioning and scalability.

Data Engineering Process Fundamentals - Data Pipeline Containers

Monitor and Operations

Monitoring your data pipeline's performance with telemetry data is key to smooth operations. This enables the operations team to proactively identify and address issues, ensuring efficient data delivery.

Key Components:

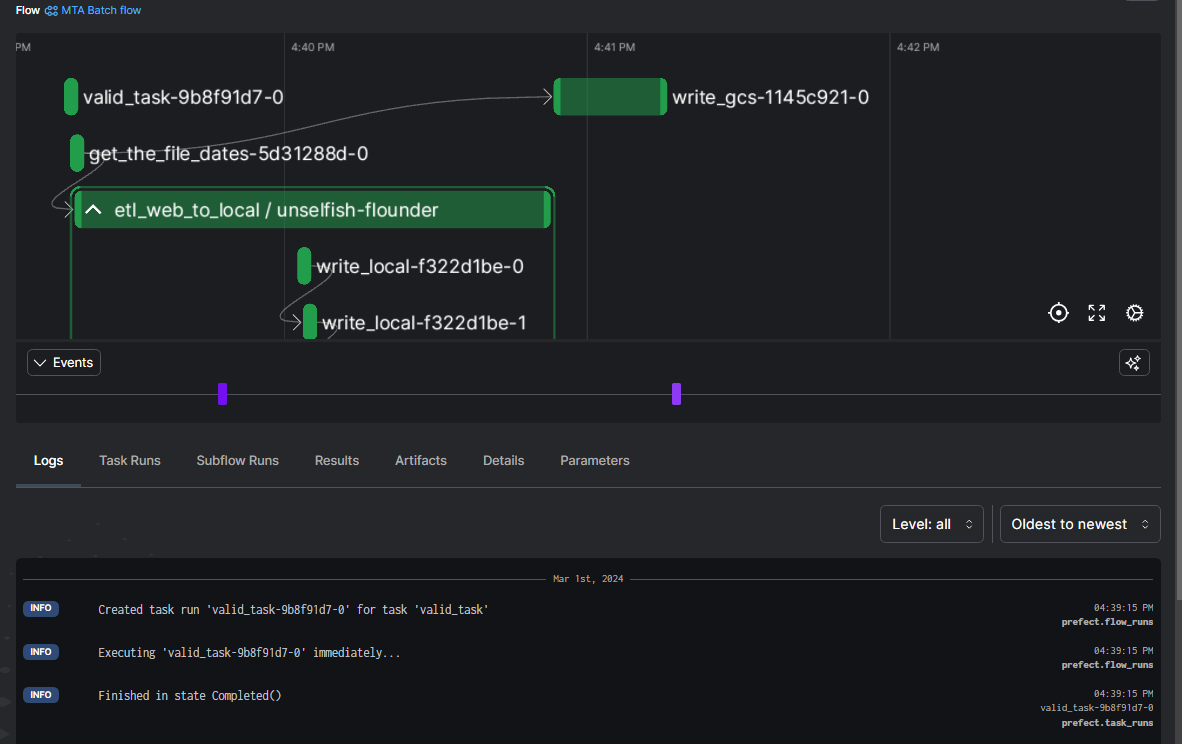
  • Telemetry Tracing: Tracks the execution of flows and tasks, providing detailed information about their performance, such as execution time, resource utilization, and error messages.

  • Monitor and Dashboards: Visualize key performance indicators (KPIs) through user-friendly dashboards, offering real-time insights into overall pipeline health and facilitating anomaly detection.

  • Notifications to Support: Timely alerts are essential for the operations team to be notified of any critical issues or performance deviations, enabling them to take necessary actions.

Data Engineering Process Fundamentals - Data Pipeline Dashboard

Summary

A data pipeline is basically a workflow of tasks that can be executed in Docker containers. The execution, scheduling, managing and monitoring of the pipeline is referred as orchestration. In order to support the operations of the pipeline and its orchestration, we need to provision a VM and data lake cloud resources, which we can also automate with Terraform. By selecting the appropriate programming language and orchestration tools, we can construct resilient pipelines capable of scaling and meeting evolving data demands effectively.

Thanks for reading.

Send question or comment at Twitter @ozkary 👍 Originally published by ozkary.com